Data about Calgary's population
Reports and profiles based on Census of Canada data, Calgary Civic Census data, and more. These data products include profiles about Calgary as well as information about specific topics and populations.
This page contains a variety of research and data products that provide an in-depth look at Calgary overall. Data for wards and communities is also available.
2021 Calgary profile
Calgary profile information from the 2021 Census of Canada.
Population
In 2021, the population of Calgary was 1,306,780, up 5.5 per cent from 1,239,220 in 2016. In 2021, there were 531,062 private dwellings in Calgary, up 8.5 per cent from 489,650 in 2016. 502,301 dwellings were occupied by usual or permanent residents, while 28,761 of these dwellings were either unoccupied or occupied only by temporary residents (98-10-0002-01).
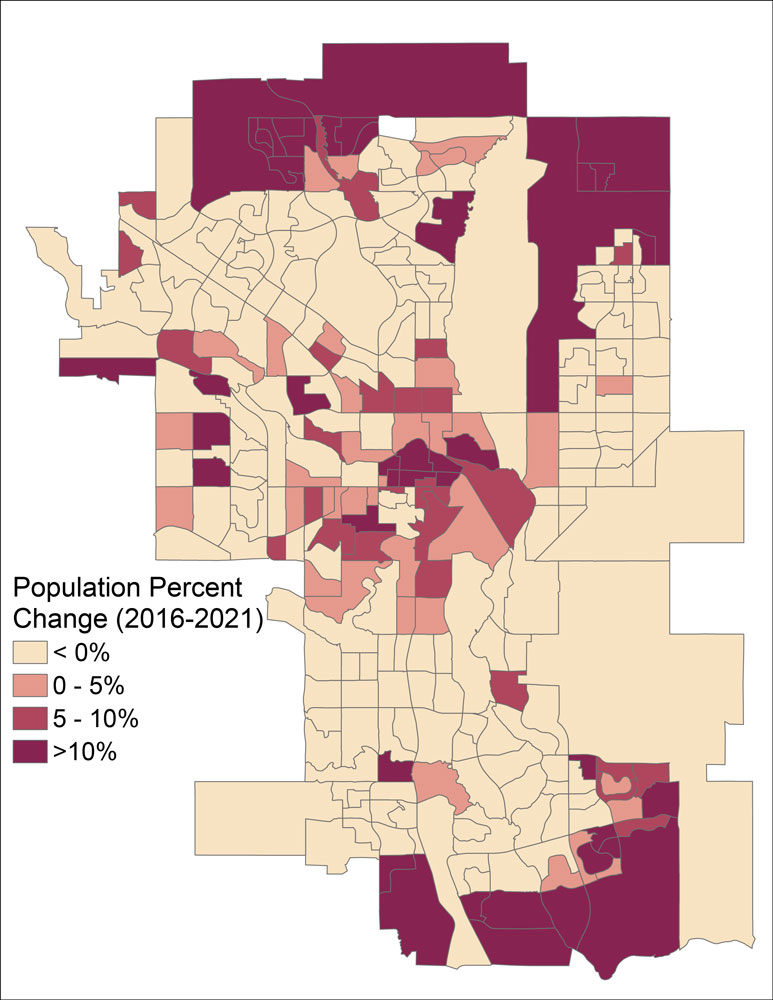
Areas in and near the Greater Downtown as well as some new communities on the edges of Calgary experienced the highest rates of population growth between 2016 and 2021. Many areas in Calgary experienced population decline over this five-year period (98-316-X2021001).
Percent population change by census tract, 2016-2021
Gender
Statistics Canada collected data about transgender and non-binary populations for the first time on the 2021 census. Canada is the first country to provide census data on transgender and non-binary people. Data is available for the population aged 15 and over in the Calgary Census Metropolitan Area (Calgary CMA, composed of Calgary, Airdrie, Rocky View County, Cochrane, Chestermere, Crossfield, Tsuu T’ina Nation, Irricana, and Beiseker).
In 2021, there were 4,640 transgender and non-binary Calgarians, including 1,245 transgender men, 1,525 transgender women and 1,870 non-binary persons. About two-thirds of transgender and non-binary people in Calgary were aged 15 to 34 years (98-10-0037-01).
Age
In 2021, there were 177,405 Calgarians aged 65 years and over, up 28 per cent from 138,405 in 2016. Over the past 20 years, the population aged 65 years and over was the fastest growing age group in Calgary. Since 2001, the population aged 65 years and over has more than doubled from 81,150. In 2021, 14 per cent of the population in Calgary was aged 65 years and over (98-10-0022-01; 95F0300XCB2001006).
In 2021, there were 240,245 Calgarians aged 15 to 29, down 3 per cent from 248,510 in 2016. Over the past 20 years, the population aged 15 to 29 years was the slowest growing age group in Calgary. Since 2001, the population aged 15 to 29 years increased by 21 per cent, less than half the rate of increase for the general population. In 2021, 18 per cent of the population in Calgary was aged 15 to 29 (98-10-0022-01; 95F0300XCB2001006).
Compared with major Canadian cities in 2021, Calgary had a relatively low median age, at 38 years. Edmonton and Regina had lower median ages than Calgary, while Montreal, Winnipeg, Toronto, Ottawa, Halifax, and Greater Vancouver had higher median ages (98-10-0022-01).
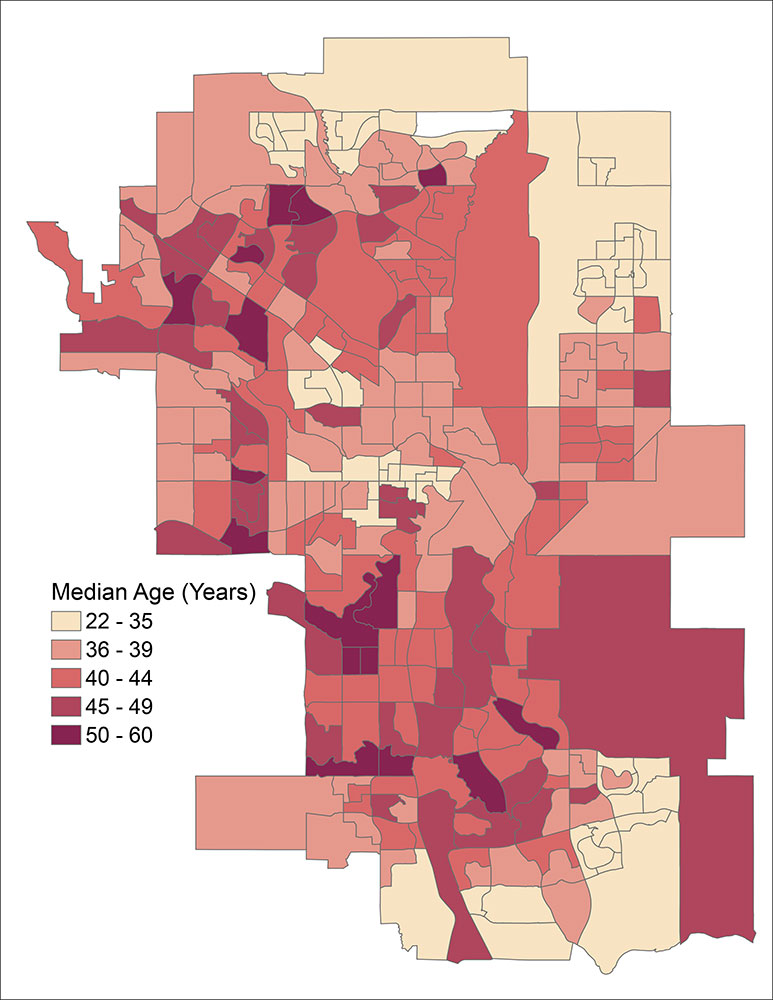
Median age varied greatly across Calgary. Areas in and near the Greater Downtown, the University of Calgary, and newer communities in the northeast, south, and north had the lowest median ages. A census tract south of the Glenmore reservoir had the highest median age in Calgary at 60 years (98-316-X2021001).
Median age by census tract, 2021
Dwellings
In 2021, there were 502,300 private dwellings in Calgary that were occupied by usual or permanent residents. About half of occupied private dwellings in Calgary (55 per cent) were single-detached houses while about one in four (24 per cent) were apartments (98-10-0041-01).
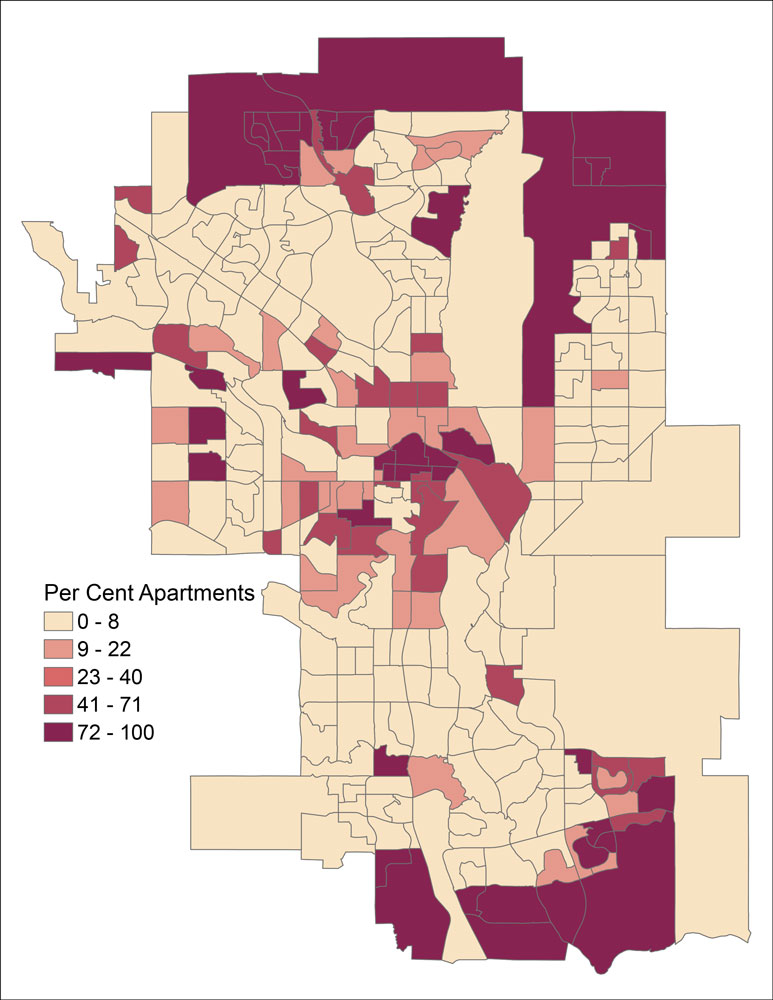
Areas in the Greater Downtown had the highest percentage of apartments, followed by areas in older communities in the developed areas as well as some new communities in the south, northwest, and west. Many areas in Calgary had few or no apartments (98-316-X2021001).
The average household size in Calgary in 2021 was 2.6 persons. The average household size in Calgary remains unchanged from 20 years ago. Average household size varied with the structural type of dwelling with single-detached houses having the highest average size at 3.0 persons and apartments in buildings with five or more storeys having the lowest average size at 1.6 persons (98-10-0041-01; 95F0323XCB2001006).
In 2021, 16,550 residents of the Calgary CMA lived in collective dwellings. Collective dwellings are commercial, institutional, or communal in nature and provide care or services or have certain common facilities such as a kitchen or bathroom that are shared by the occupants. Examples include lodging or rooming houses, hotels, motels, tourist establishments, nursing homes, residences for senior citizens, hospitals, staff residences, military bases, work camps, correctional facilities and group homes (98-10-0046-01).
Percent apartments by census tract, 2021
Families
A census family is a married couple (with or without children), a common-law couple (with or without children) or a one-parent family. In 2021, there were 356,225 census families in private households in Calgary and the average family size was about three people. Approximately 46 per cent of families had two people while 44 percent of families had three or four persons. About nine percent of families were made up of five or more persons (98-316-X2021001).
Of all families, 85 per cent were couple families and the remaining 15 per cent were one-parent families. In nearly four out of five one-parent families, the parent was a woman+ (98-316-X2021001).
New in 2021, Statistics Canada published to information about different-gender couples, same-gender couples and transgender or non-binary couples. In the Calgary CMA, there were 5,000 same-gender, transgender or non-binary couple families. These families made up 1.5 per cent of all couple families (98-10-0136-01).
Households
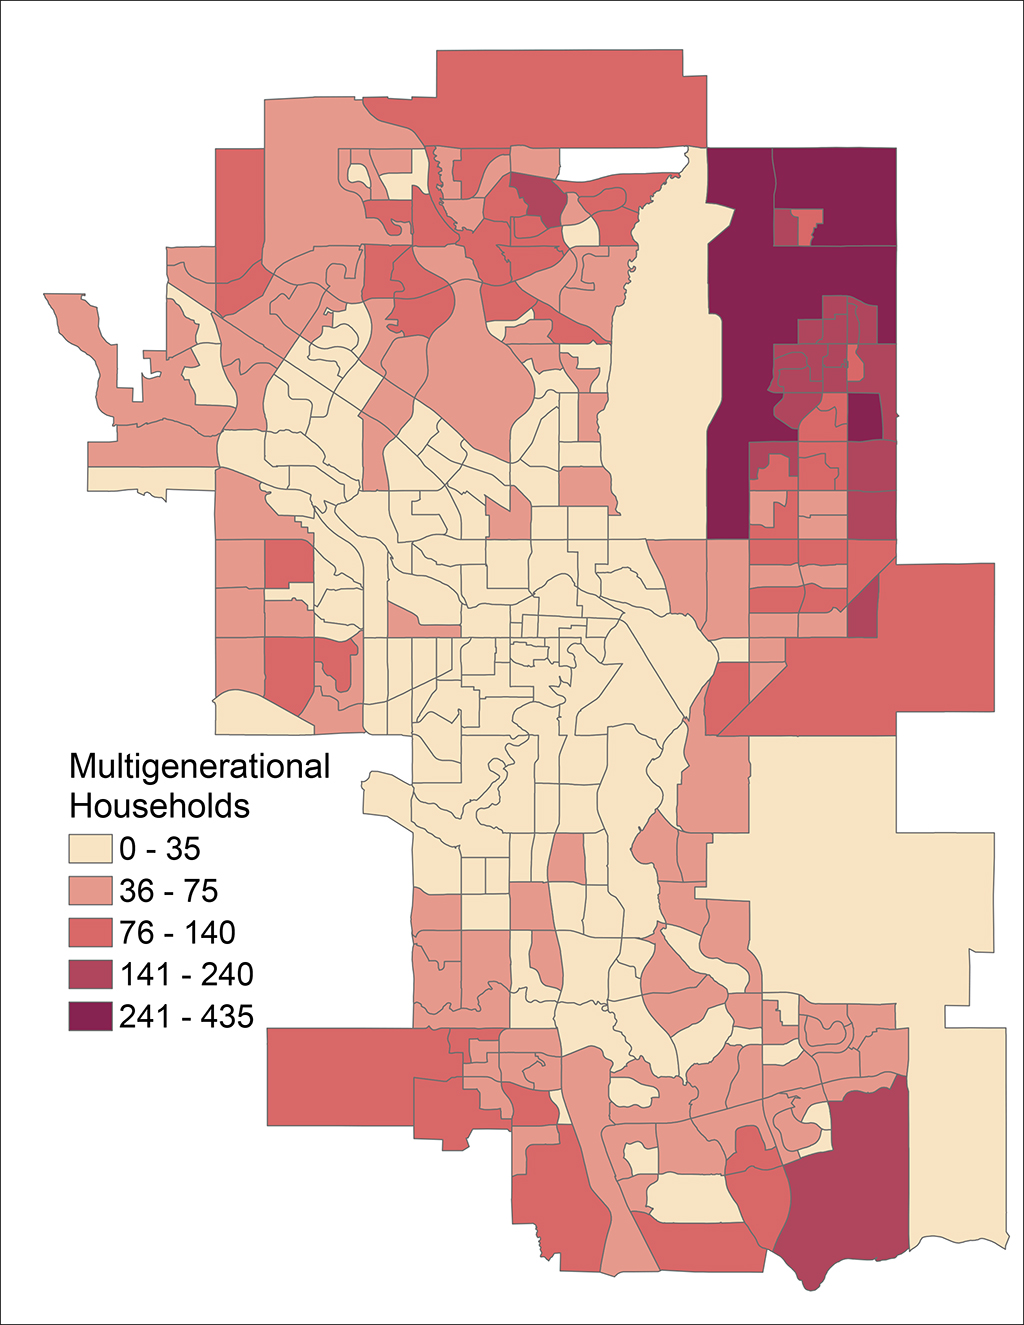
A household is a person or group of persons who occupy the same dwelling. The household may consist of a family group, two or more families sharing a dwelling, a group of unrelated persons or a person living alone. In 2021, there were 502,300 households in Calgary, including 17,040 multigenerational households and 132,690 one-person households. Areas on the edges of Calgary, particularly those in the northeast, had the highest numbers of multigenerational households (98-316-X2021001).
Living arrangements in Calgary have changed somewhat over time. In 2021, 12.6 per cent of adults aged 15 and over living in private households were living alone, compared to 11.5 per cent in 2016. In 2021, the proportion of young adults aged 20 to 34 that were living with at least one parent was 32.8 per cent, compared to 28.6 per cent in 2016 (Focus on Geography Series, 2021 Census).
Multigenerational households by census tract, 2021
Income
Note: the COVID-19 pandemic had significant impacts on the income of Canadians. Typically, the 2021 census results would include income figures from only the 2020 calendar year. To provide baseline information about the economic impact of COVID-19, Statistics Canada has provided some additional information about the income of individuals in 2019.
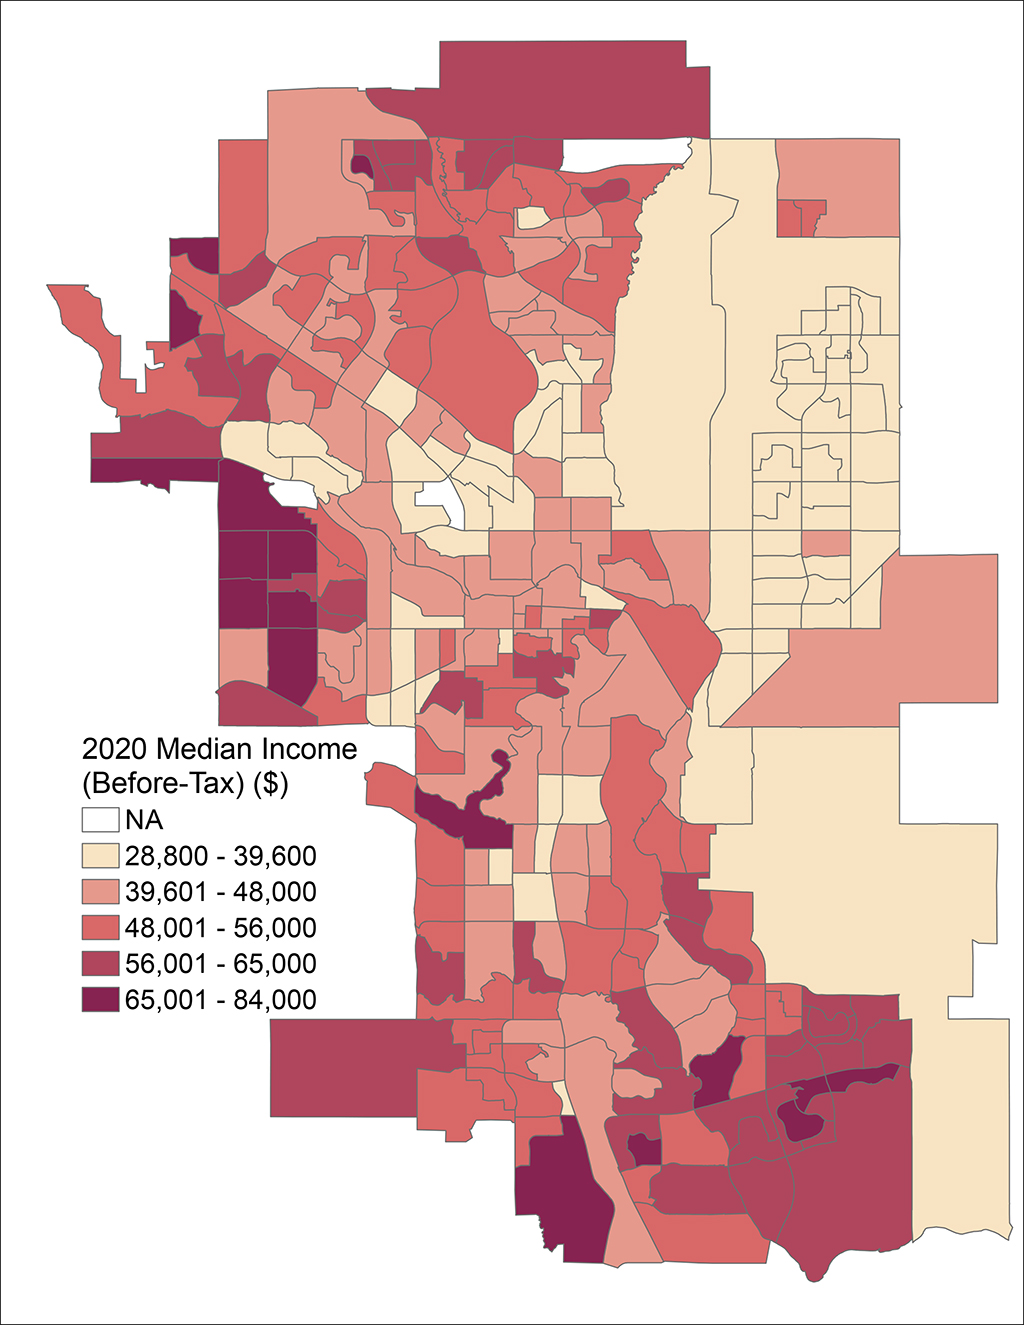
In 2020, the median before-tax income of individuals in Calgary was $44,440, up slightly from 2019 when the median income was $43,600. Median individual incomes were highest on the west side of Calgary. In 2020, the median before-tax household income in Calgary was $98,000 (98-316-X2021001).
Likely due to the COVID-19 pandemic, the composition of individual income changed between 2019 and 2020. In 2019, Calgarians received 92 per cent of their income from market sources like employment and 8 per cent from government transfers like employment insurance. In 2020, the share of income from market sources fell to 86 per cent, with 14 per cent coming from government transfers (98-316-X2021001).
The gender wage gap in Calgary shrunk slightly between 2019 and 2020, possibly due to the equalizing effect of COVID-19 financial supports. In 2019, the median before-tax income of women+ was 73% that of men+. In 2020, the median before-tax income of women+ was 78% that of men+, up five percentage points (98-316-X2021001).
Seven out of ten households in the Calgary CMA contributed to a registered savings account in 2020. Registered savings accounts are tax free savings accounts, registered retirement savings plans and registered pension plans. Households where the major income earner was aged 15 to 24 years or 71 years and over were less likely to contribute. About 37 per cent households with incomes less than $50,000 after-tax contributed, compared with 90 per cent of households with incomes $100,000 or more (98-10-0085-01).
Median before-tax income by census tract, 2020
Income inequality
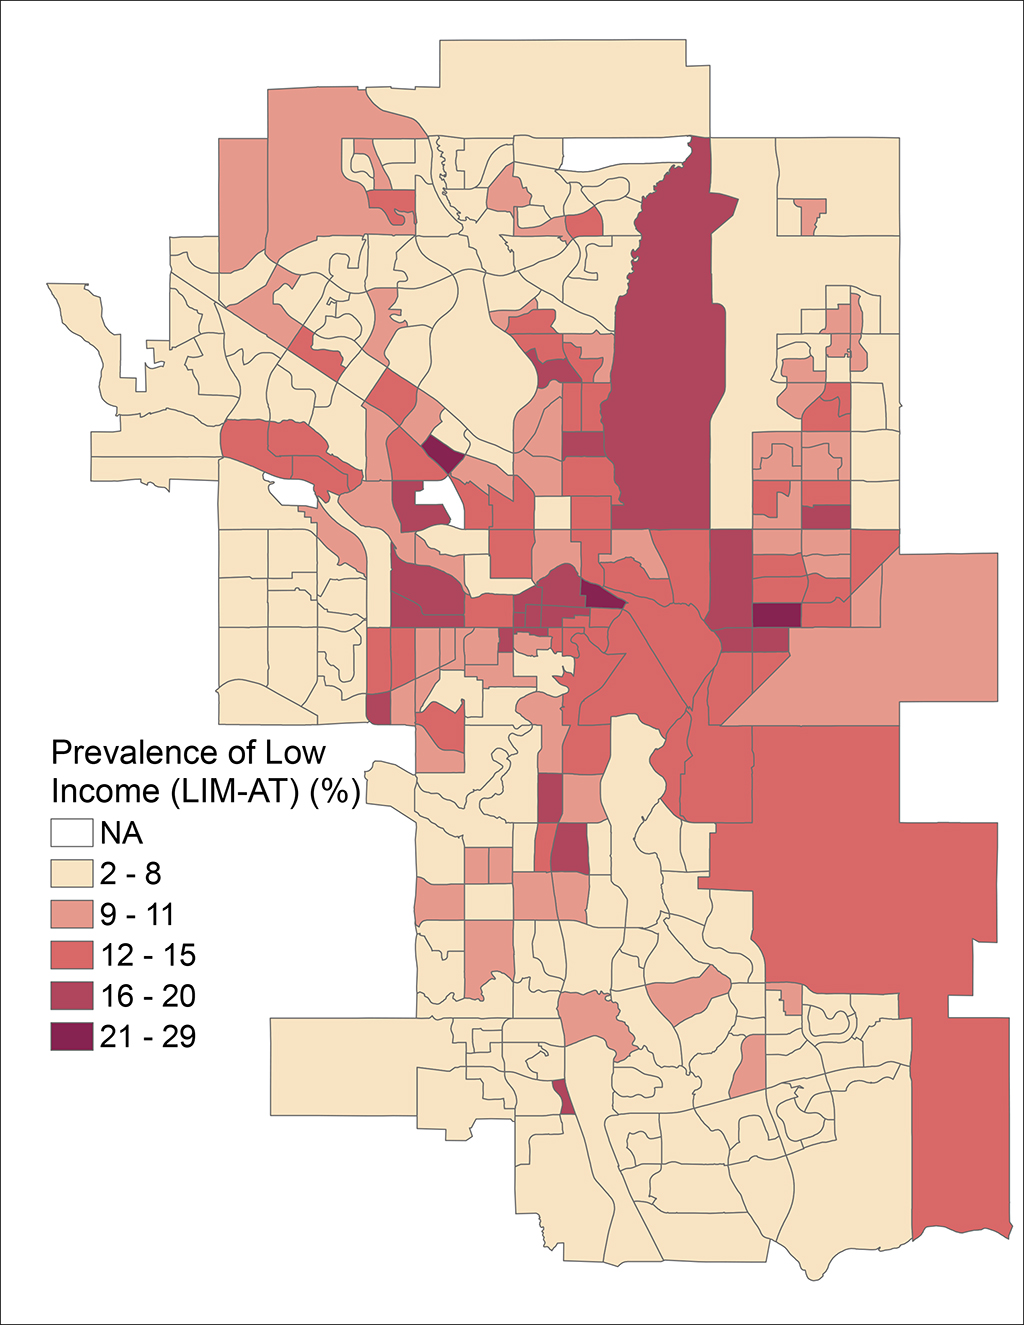
In 2020 in Calgary, 115,560 people were in low income based on the Low-income measure, after tax (LIM-AT), up slightly from 112,505 in 2015. In all, 8.9 per cent of the population was in low income. Seniors and people aged 0 to 17 years had slightly higher rates of low income than the general population at 10.4 per cent and 10.7 per cent, respectively. Low-income rates were lowest around the edges of Calgary (98-10-0103-01).
New in 2021, Statistics Canada has provided data regarding income inequality in Canada. The Gini index indicates how equally income is distributed in a population. A value closer to 0 indicates a more equal distribution of income and a value closer to 1 indicates a more unequal distribution of income. The Gini index for Calgary in 2020 was 0.376, indicating more equal incomes than in 2015 when the index value was 0.442 (98-316-X2021001).
Another measure of income inequality is the ratio of income between the top and bottom earners. In 2020, the highest earning 10 per cent of households earned 4.1 times more than the lowest earning 10 per cent of households, indicating more equality than in 2015 when the highest earning households earned 5.1 times more than the lowest (98-316-X2021001).
Improved income equality in 2020 was observed across Canada and may be due to the equalizing effect of COVID-19 financial supports. In comparison with the twelve Canadian cities with a population of 500,000 or more, Calgary is the third most unequal based on both the Gini index and the ratio of income between top and bottom earners, after Toronto and Vancouver (98-10-0096-01).
Percent in low income (LIM-AT) by census tract, 2020
Languages
Knowledge of official languages
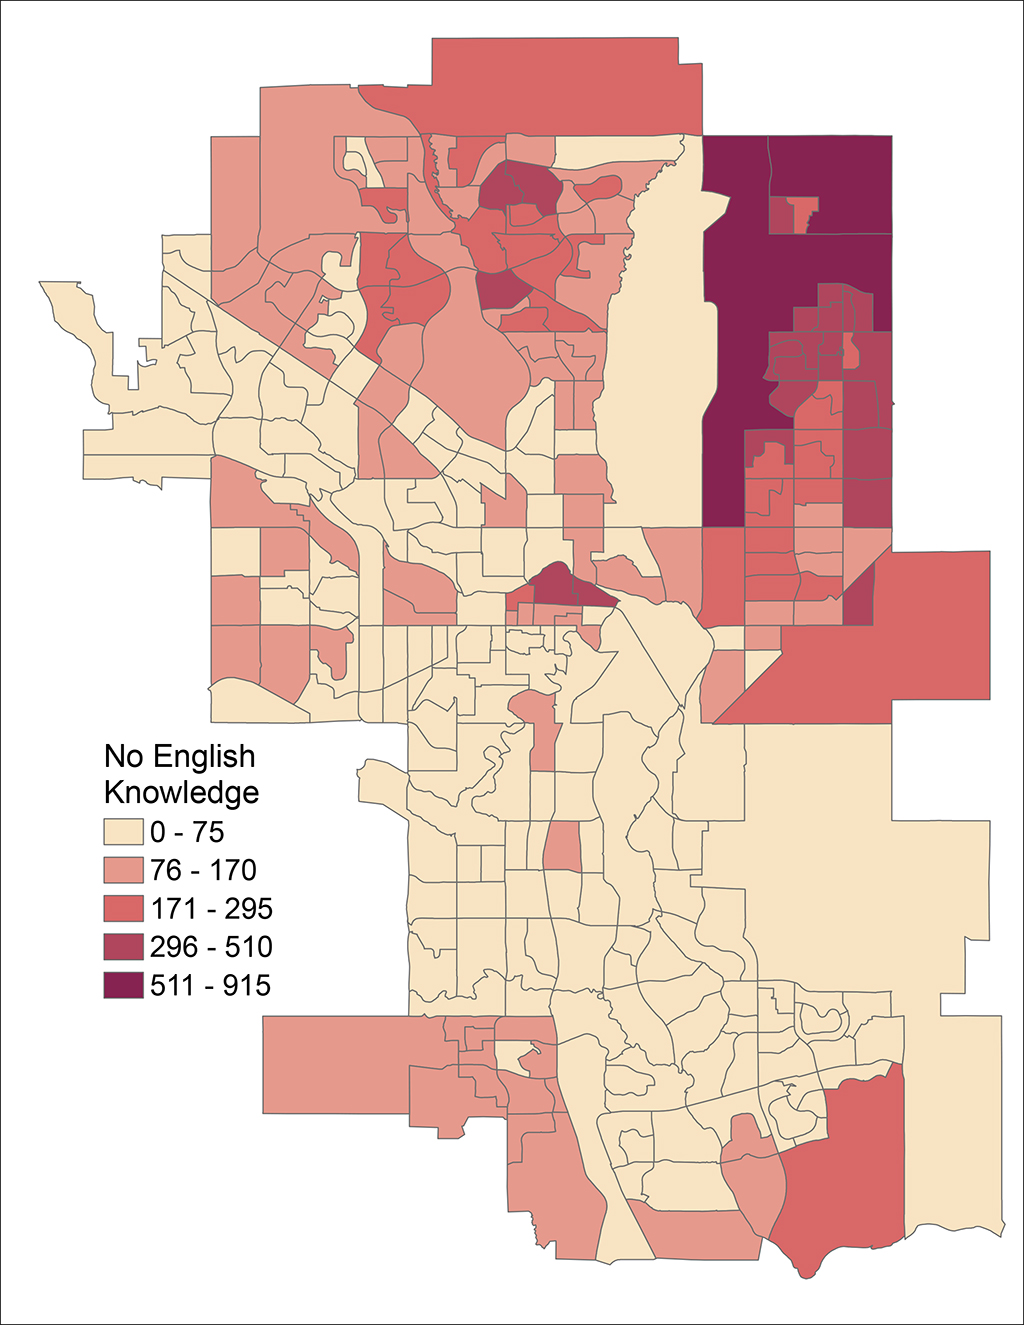
Knowledge of official languages refers to whether the person can conduct a conversation in English only, French only, in both or in neither language. For a child who has not yet learned to speak, this includes languages that the child is learning to speak at home. In 2021, 97.4 per cent of the population in private households in Calgary had knowledge of English. A person who has knowledge of French only or neither English nor French is considered to have no English knowledge. In 2021, in Calgary there were 33,345 people or 2.6 per cent of the population who had no English knowledge. The percentage of the population with no English knowledge remained stable between 2016 and 2021. Most of the people with no English knowledge resided in NE Calgary (98-316-X2021001).
Knowledge of non-official languages
In Calgary in 2021, about 40 per cent of the population had knowledge of at least one non-official language. The top ten Indigenous languages spoken by Calgarians were Blackfoot, Cree, Nehiyawewin, Tsuu T'ina, Stoney, Saulteau, Ojibway, Inuktitut, Michif, and Nehinawewin. The top ten non-official, non-Indigenous languages were Tagalog, Punjabi, Spanish, Mandarin, Hindi, Cantonese, Arabic, Urdu, Vietnamese, and Russian (98-316-X2021001).
Mother tongue
Mother tongue refers to the first language learned at home in childhood and still understood by the person at the time the data was collected. In 2021, about 64 per cent of Calgarians had English as their mother tongue. Among non-official languages, the top ten mother tongue languages were Punjabi, Tagalog, Cantonese, Mandarin, Spanish, Arabic, Urdu, Vietnamese, Korean, and Russian (98-316-X2021001).
People with no English knowledge by census tract, 2021
Language spoken most at home
Language spoken most often at home refers to the language the person spoke most often at home at the time of data collection. A person could report more than one language as "spoken most often at home" if the languages were spoken equally often. In Calgary in 2021, among the people who most often spoke a single language at home, about 75 per cent spoke English. Approximately 19 per cent of the people spoke a single non-official language most often at home. The top ten non-official languages spoken most often of at home were Punjabi, Tagalog, Mandarin, Cantonese, Spanish, Arabic, Urdu, Vietnamese, Korean, and Russian. The top 10 languages spoken most often at home remained very similar between 2016 and 2021 (see Table) (98-316-X2021001).
Knowledge of official languages and income
In 2020, the median before-tax income of individuals in Calgary CMA was $44,800. The median income was higher for individuals with knowledge of both English and French at $50,800 compared to individuals with knowledge of English only at $45,600. The median income for those who had knowledge of neither English nor French was $21,600 (98-10-0202-01).
Knowledge of official languages and age
In 2021, about 98 per cent of those aged between 0 to 64 years in private households in Calgary had knowledge of English while about 92 per cent of people aged 65 years and over had knowledge of English. In 2021, there were 33,345 Calgarians with no knowledge of English. People aged 65 years and over made up 43 per cent of those without a knowledge of English but only 14 per cent of the population of Calgary (98-10-0170-01).
| Ranking | 2016 | 2021 |
|---|---|---|
| Ranking : 1 | 2016 : Punjabi | 2021 : Punjabi |
| Ranking : 2 | 2016 : Tagalog | 2021 : Tagalog |
| Ranking : 3 | 2016 : Cantonese | 2021 : Mandarin |
| Ranking : 4 | 2016 : Mandarin | 2021 : Cantonese |
| Ranking : 5 | 2016 : Spanish | 2021 : Spanish |
| Ranking : 6 | 2016 : Arabic | 2021 : Arabic |
| Ranking : 7 | 2016 : Urdu | 2021 : Urdu |
| Ranking : 8 | 2016 : Vietnamese | 2021 : Vietnamese |
| Ranking : 9 | 2016 : Persian | 2021 : Korean |
| Ranking : 10 | 2016 : Korean | 2021 : Russian |
Housing
Housing tenure
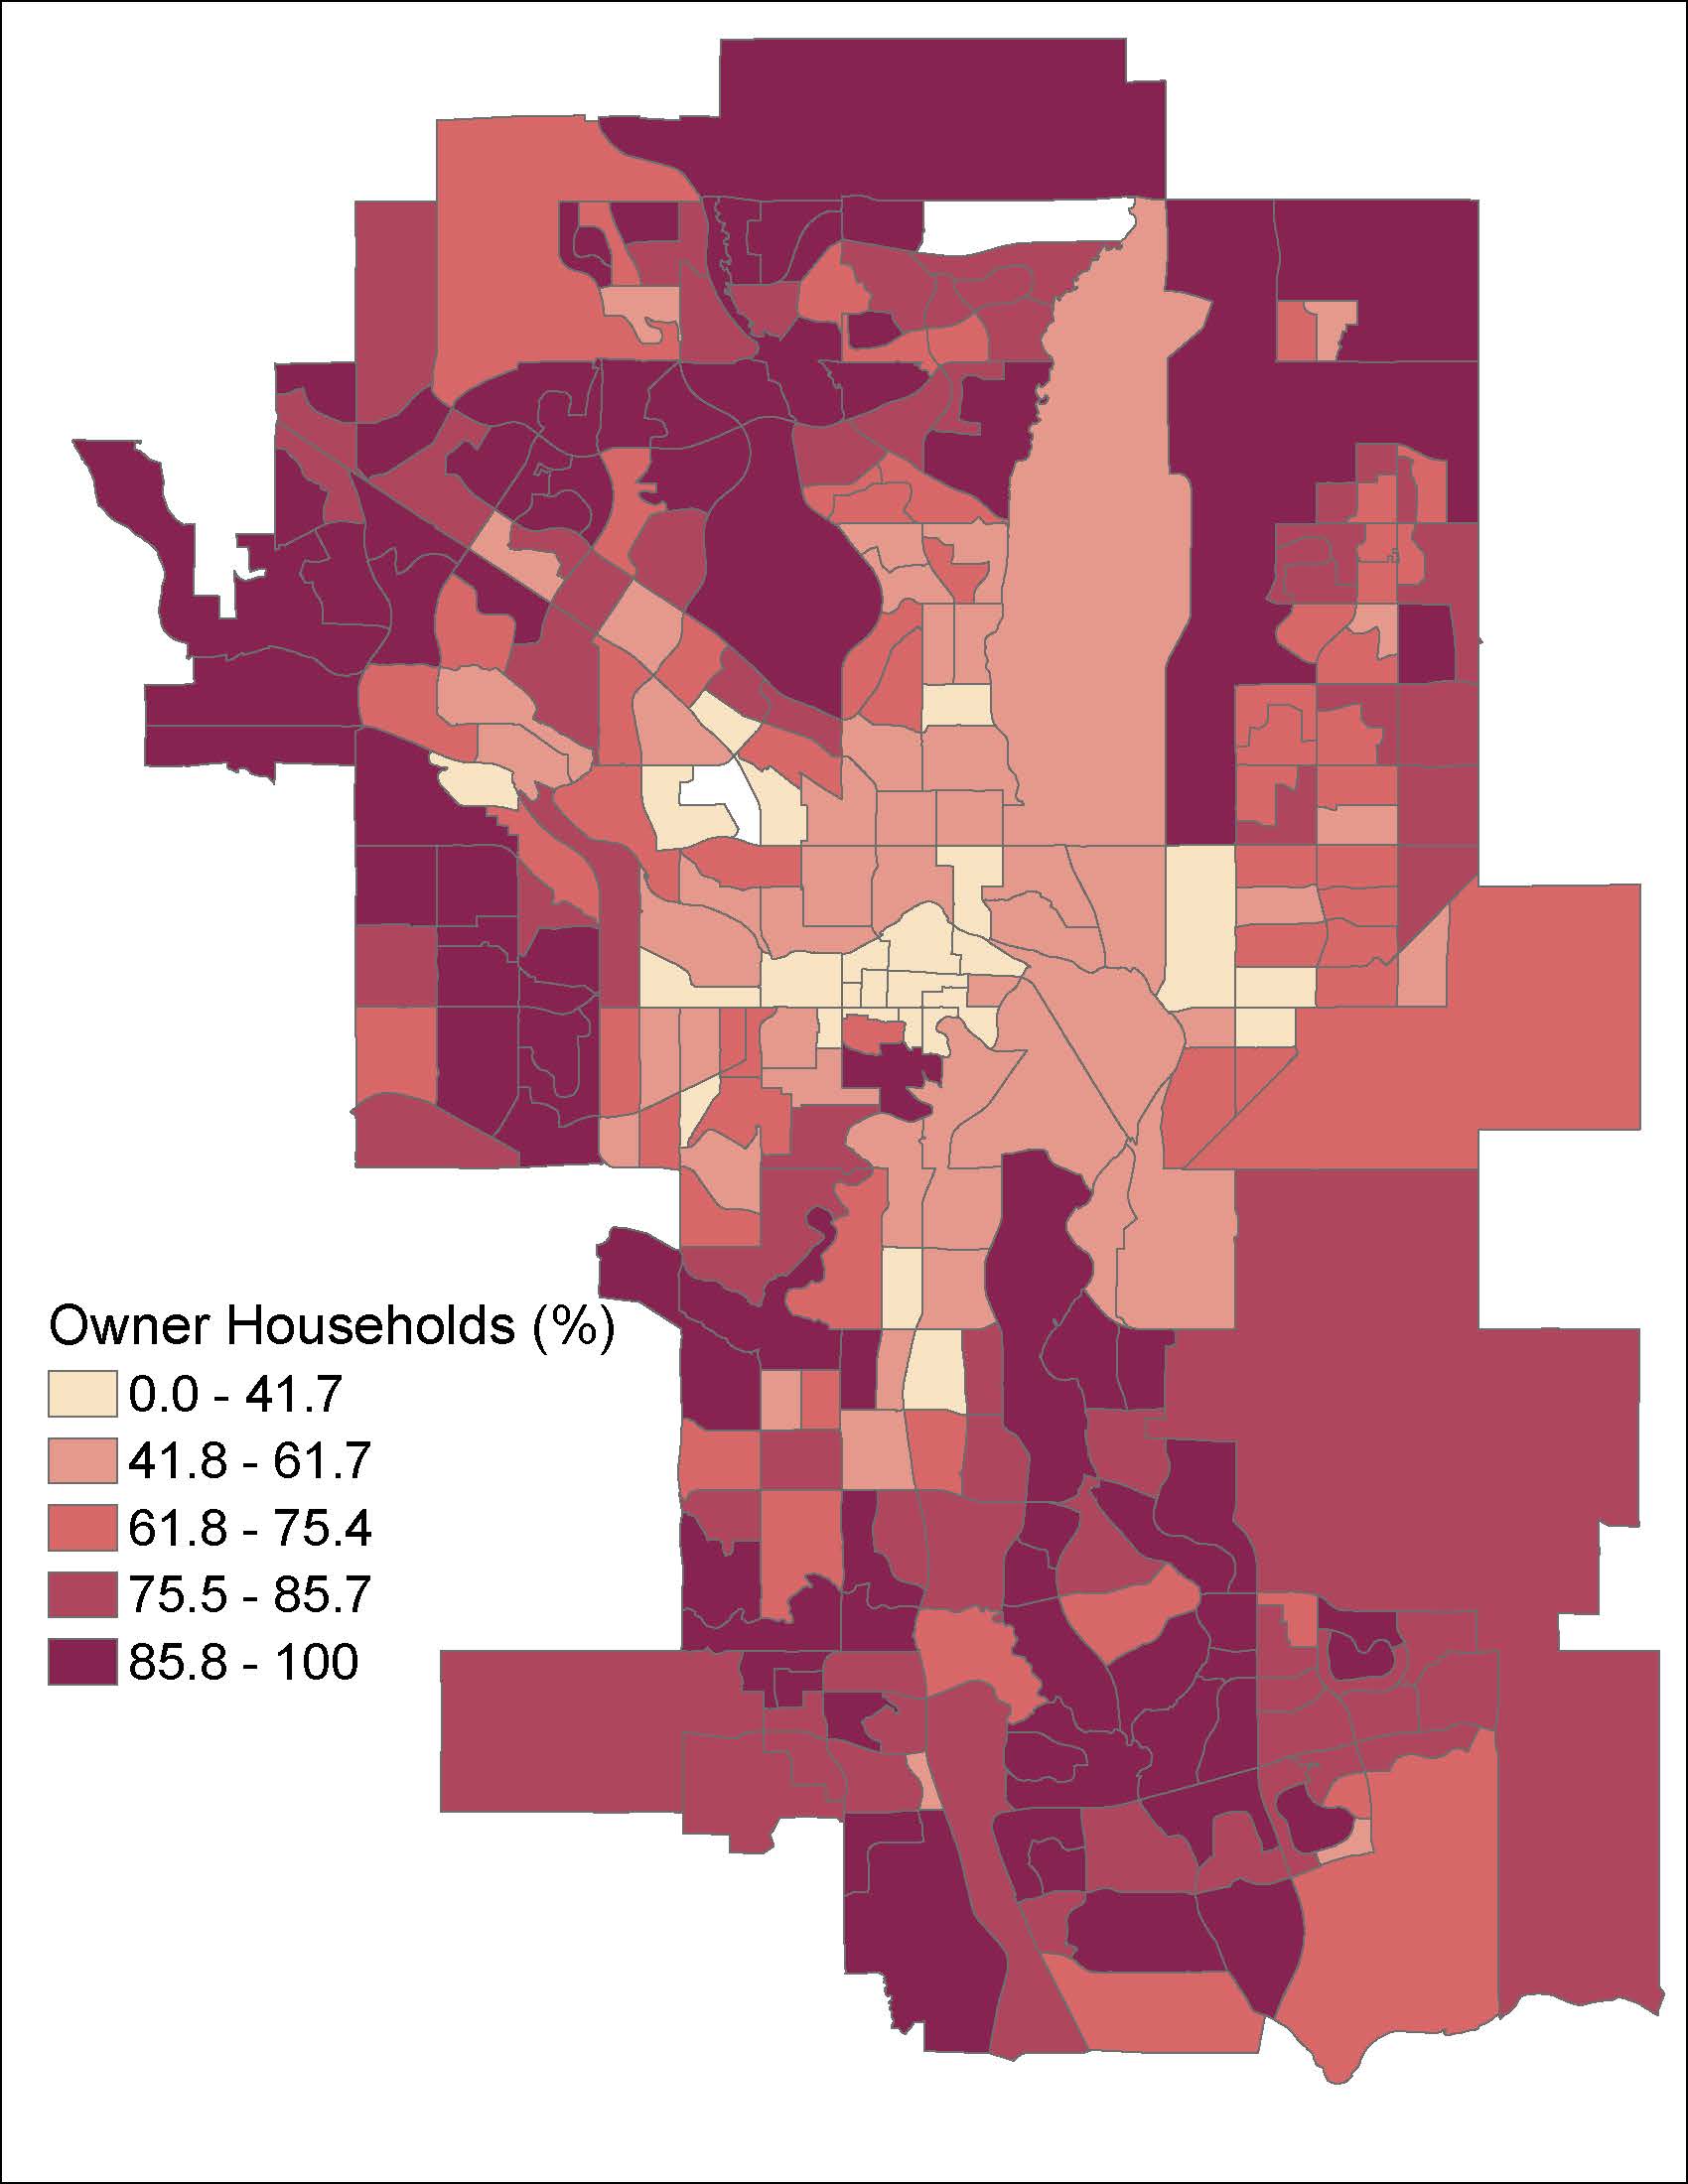
In Calgary in 2021, there were 502,305 households. Of these households, about seven in 10 owned their homes. Between 2016 and 2021, home ownership rate in Calgary remained stable. Of the 345,690 owner households, 65.2 per cent had a mortgage. The median monthly shelter costs for owned dwellings was $1,720. Of the 156,615 renter households, 9.0 per cent lived in subsidized housing. The median monthly shelter costs for rented dwellings was $1,350. The Greater Downtown area has the lowest percentage of owner houseohlds in Calgary (98-316-X2021001).
Housing suitability, adequacy, affordability and core housing need
Inadequate housing is housing that requires major repairs. In Calgary in 2021, 22,780 households lived in housing requiring major repairs (98-316-X2021001).
Housing is considered affordable if shelter costs are equal to or less than 30 per cent of the household’s before-tax income. In Calgary in 2021, 114,470 households were living in housing that was unaffordable to them (98-316-X2021001).
Housing suitability is a measure of crowding and refers to whether a dwelling has enough bedrooms for the household. In Calgary in 2021, 25,515 households lived in unsuitable housing (98-316-X2021001).
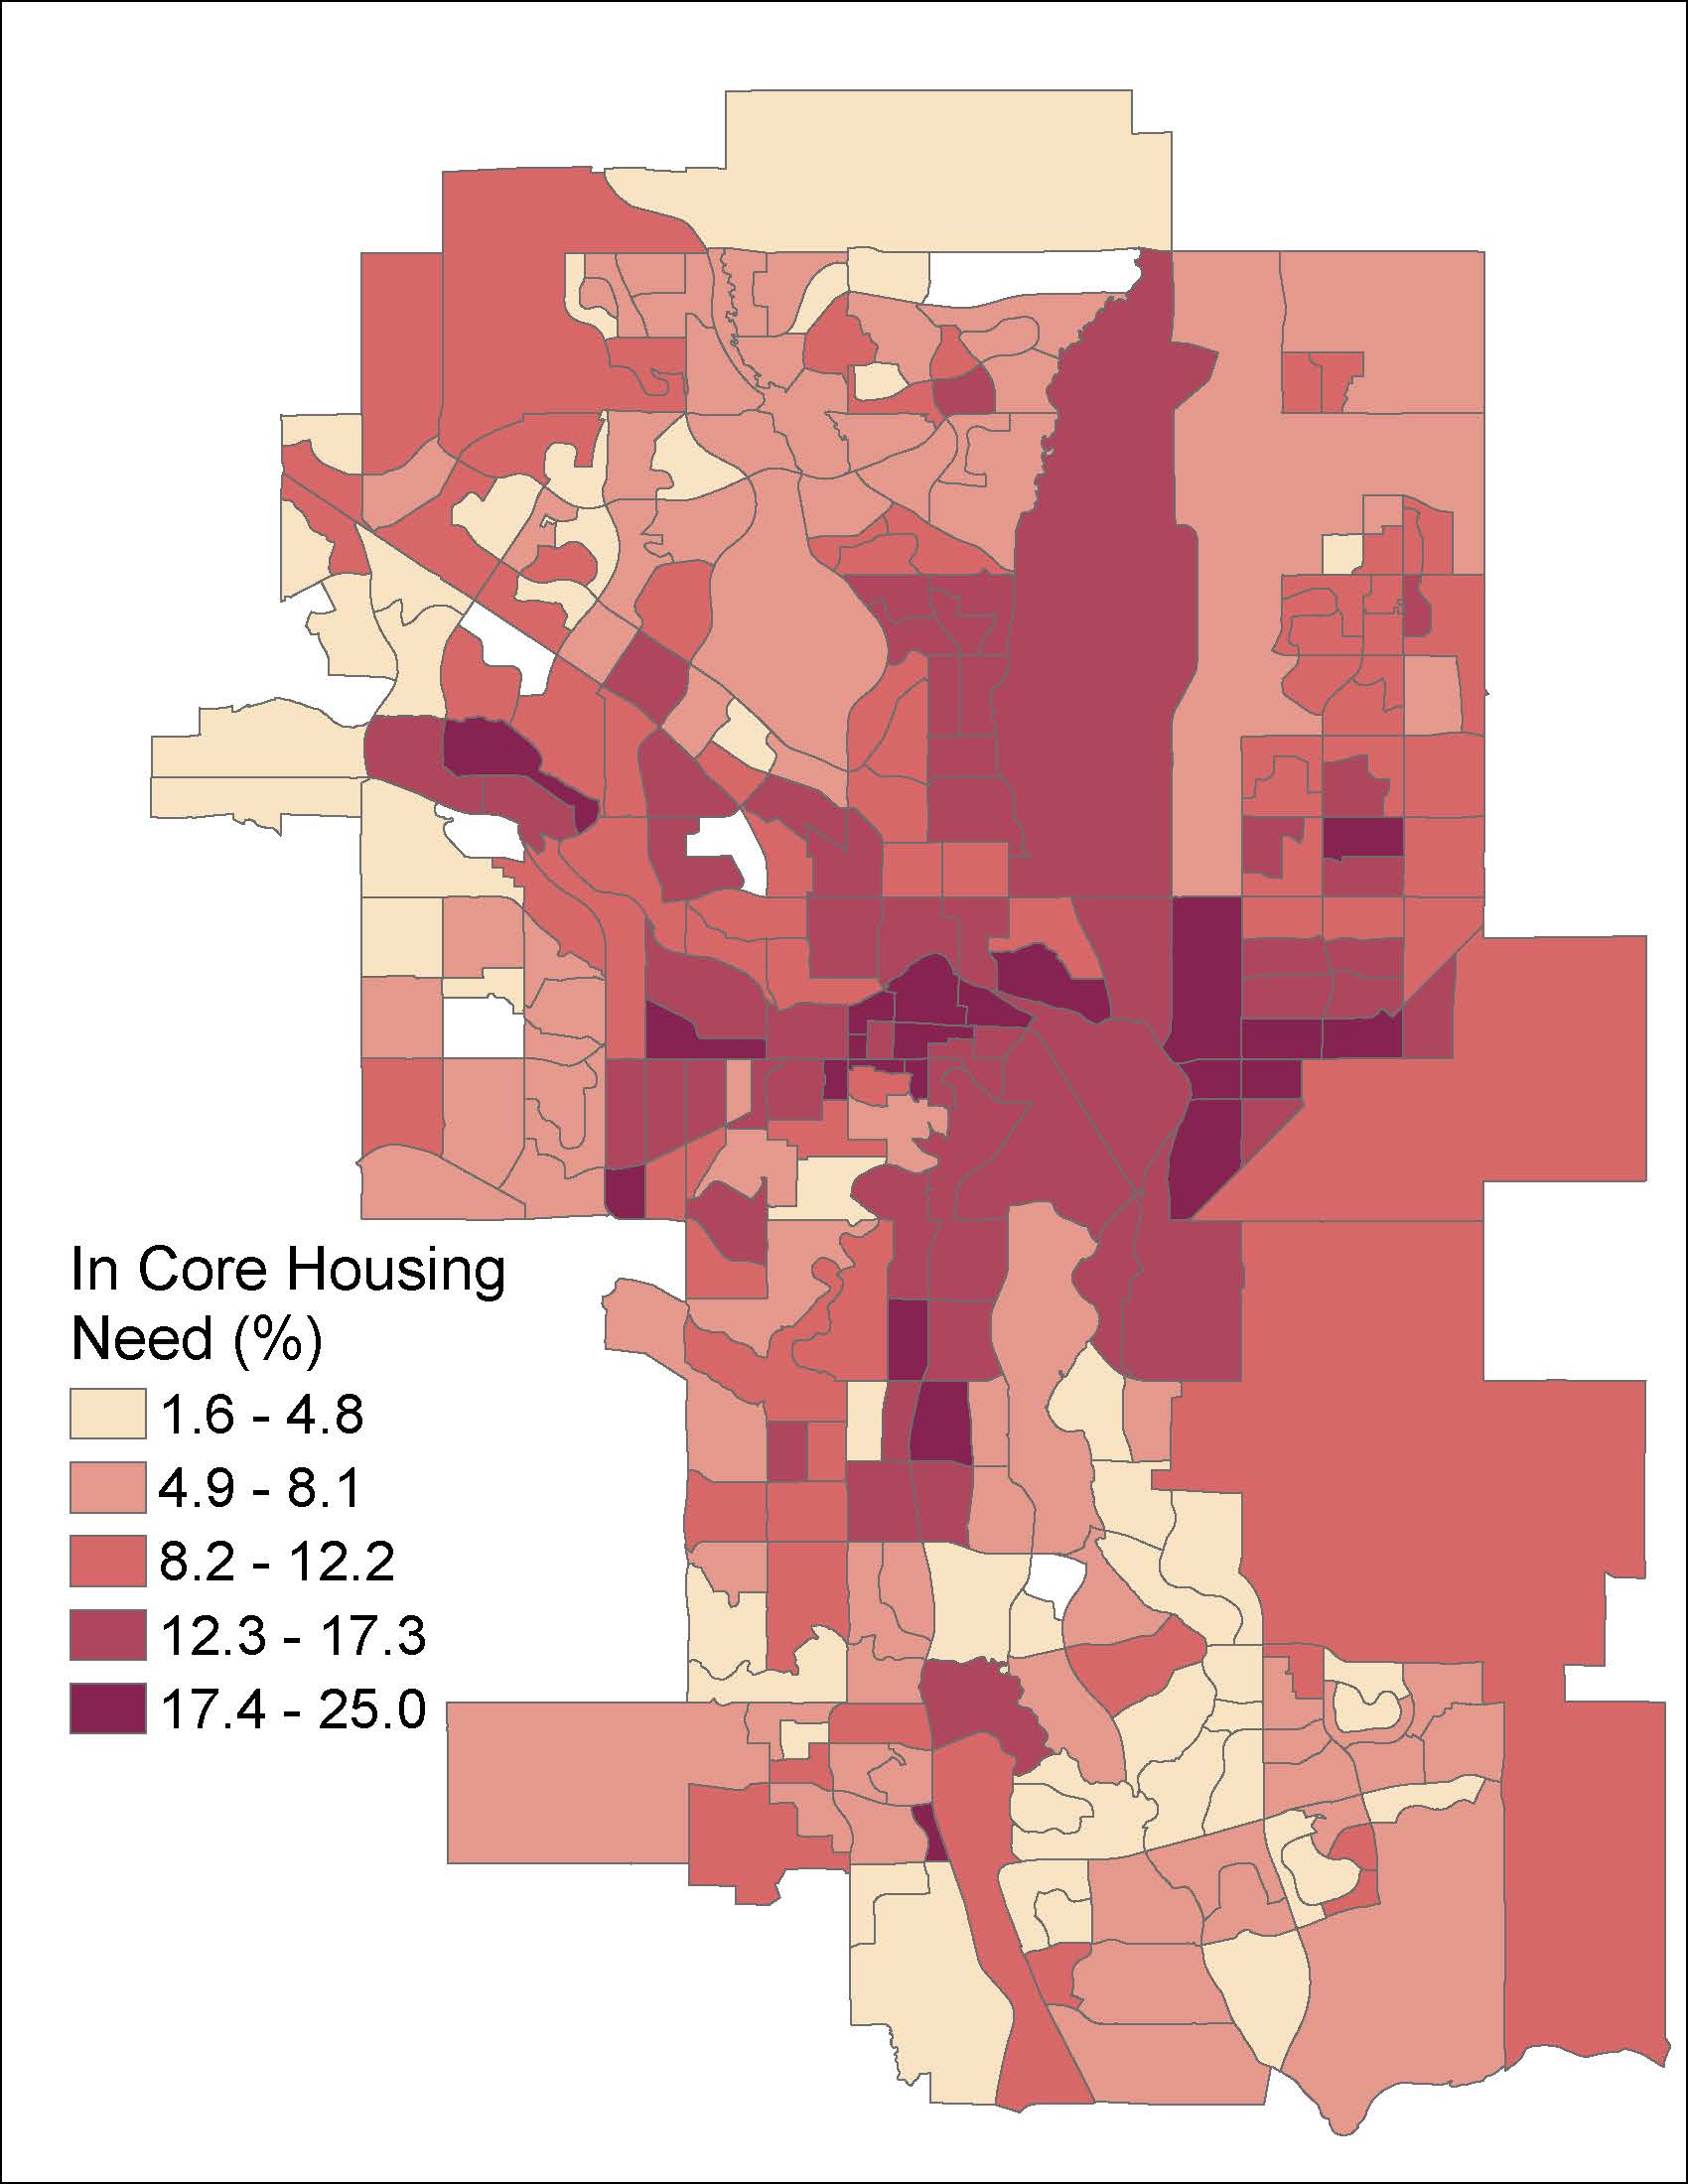
Core housing need refers to the percentage of households whose dwellings are crowded, in poor repair, or unaffordable and who cannot afford housing that meets their needs in their community. In Calgary in 2021, 49,860 households were in core housing need. This means that about one in 10 households in Calgary had limited or no housing options in their community that meets their needs and were at risk of poor housing outcomes (98-316-X2021001).
Households across Calgary experience core housing need, with the highest concentrations in central Calgary.
Age and tenure of primary household maintainer
Primary household maintainer is the first person in the household identified as someone who pays the rent, or the mortgage, or the taxes, or the electricity or other services or utilities for the dwelling. In Calgary in 2021, six out of 10 primary household maintainers were aged 35 to 64 years and of these 75 per cent were owners. Roughly 60 per cent of primary household maintainers aged 15 to 34 years were renters in 2021 in Calgary (98-10-0232-01).
Per cent owner households by census tract, 2021
Per cent households in core housing need by census tract, 2021
Indigenous peoples
Indigenous population
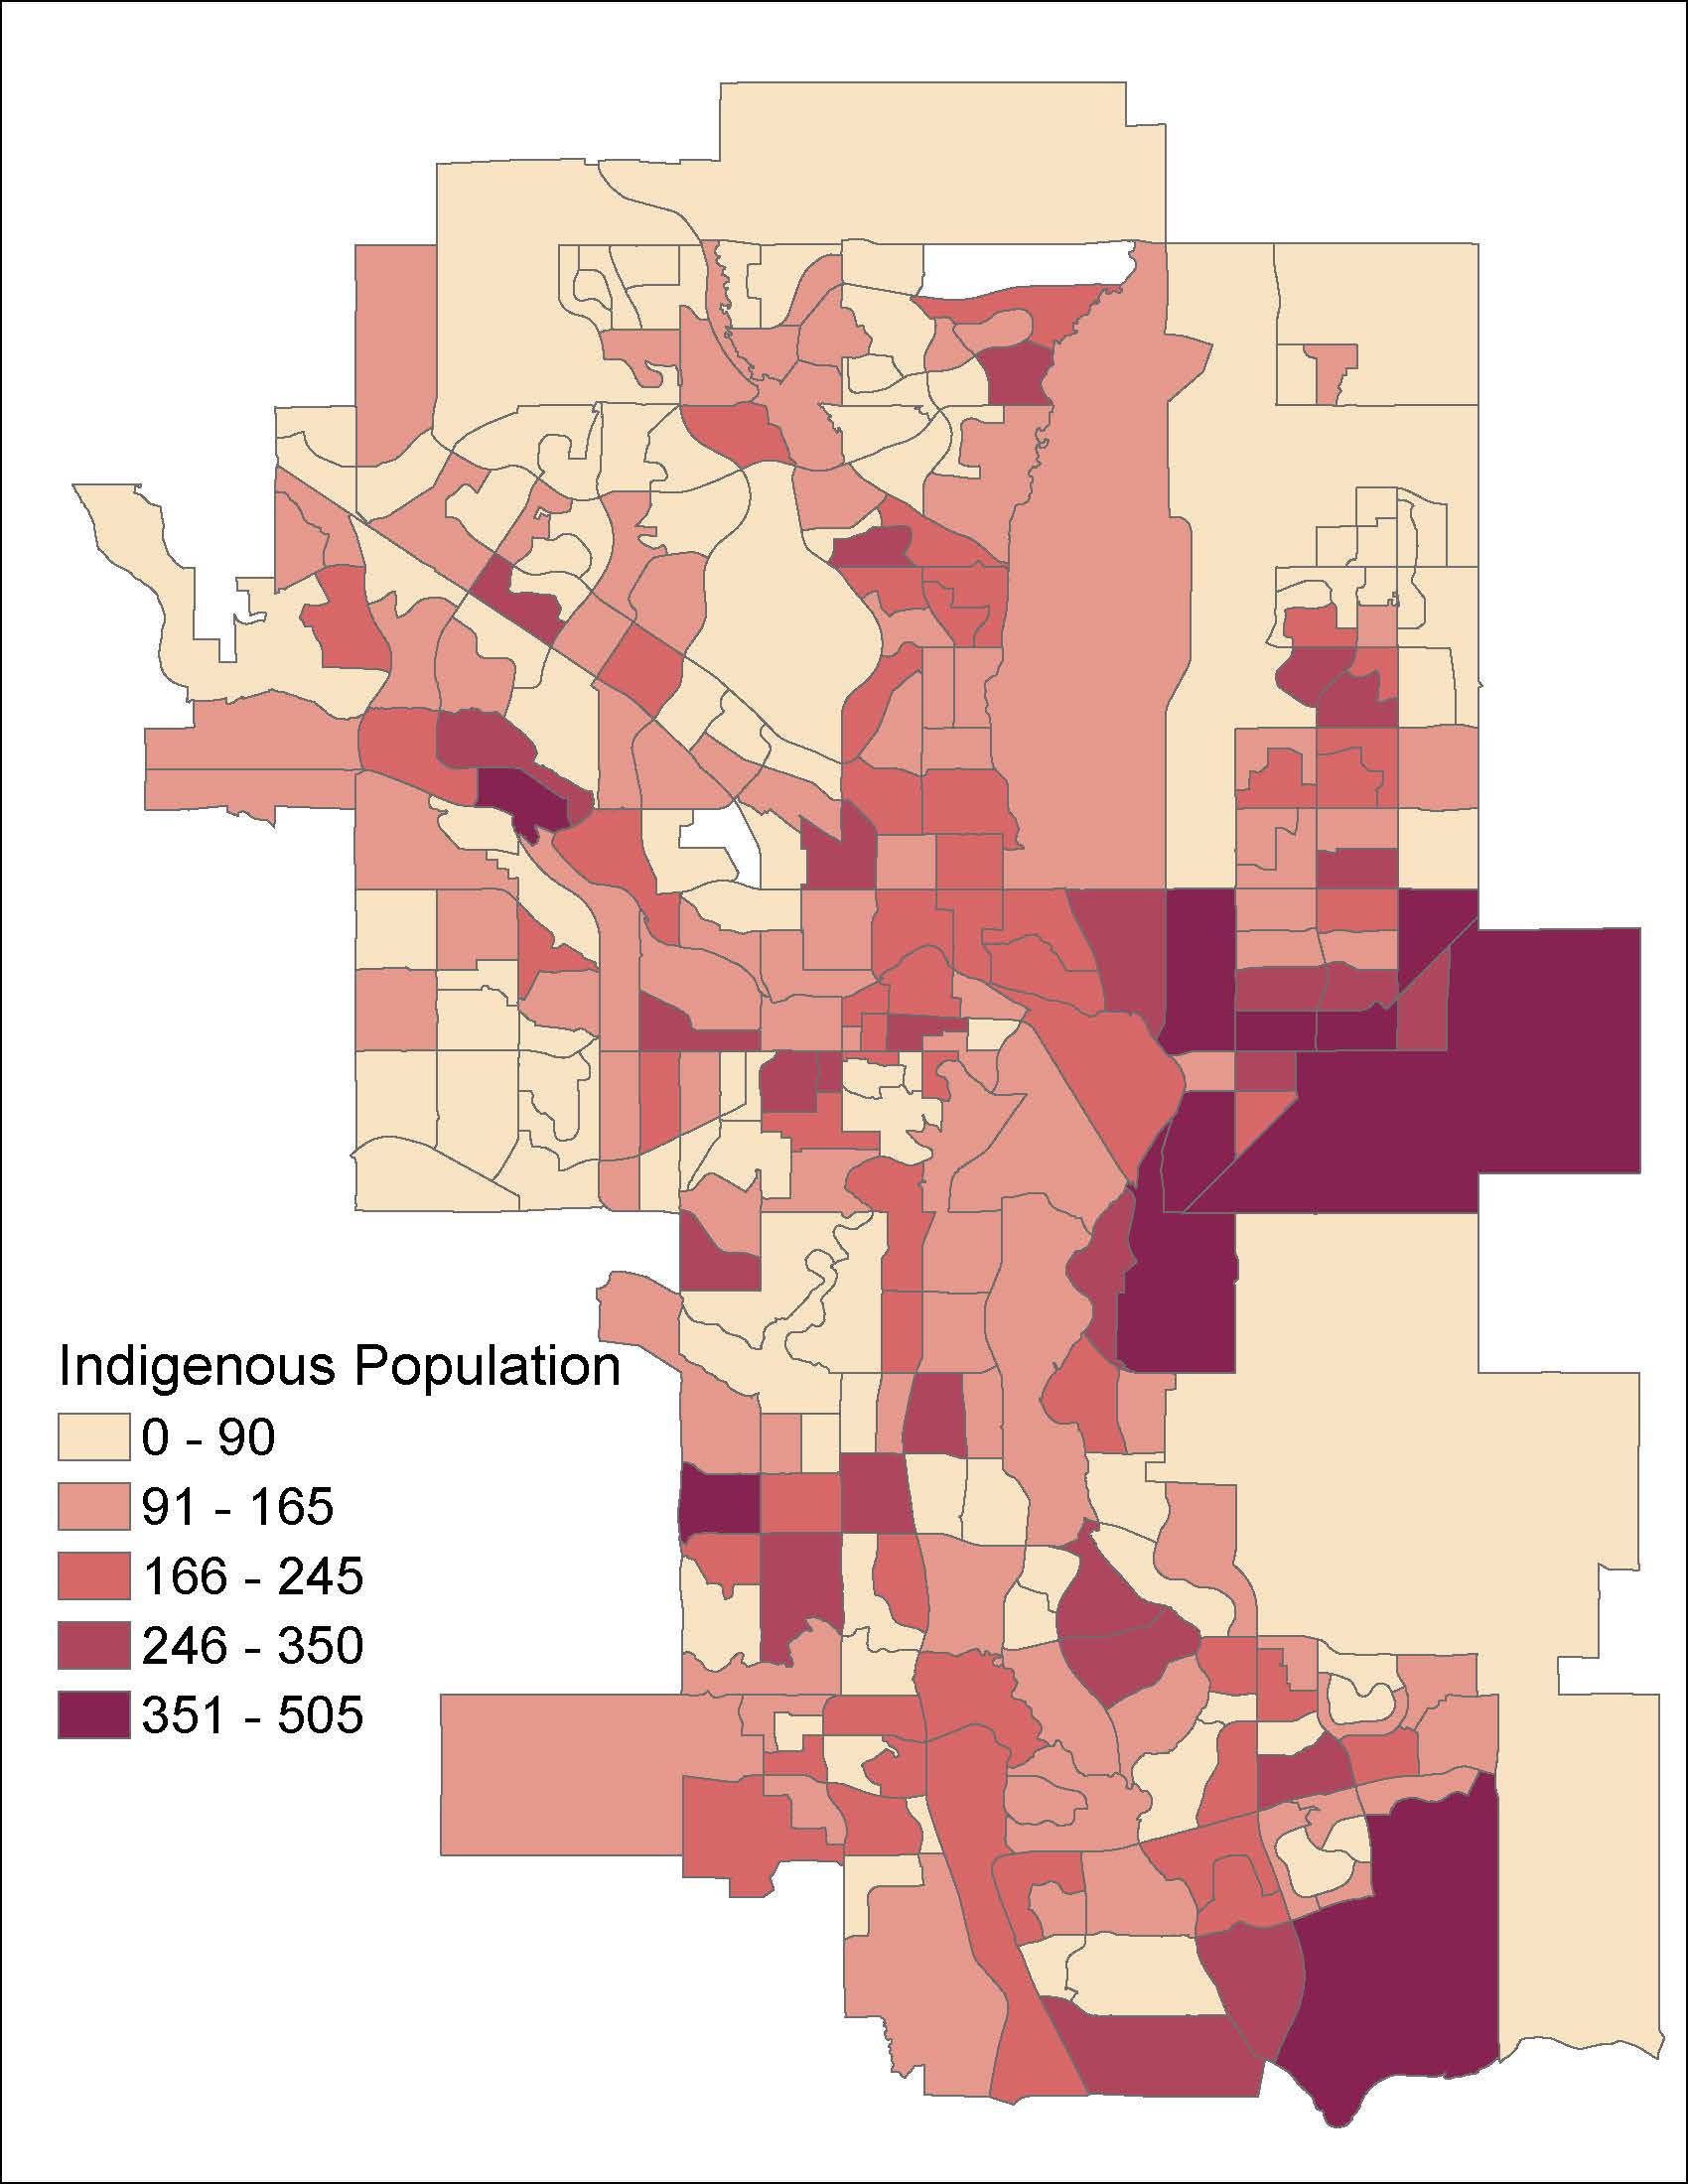
Indigenous identity includes people who identify as First Nations, Métis and/or Inuk (Inuit) and/or those who report being registered under the Indian Act of Canada as Treaty Indians and/or those who report having membership in a First Nation or Indian Band. Between 2016 and 2021, the Indigenous identity population grew at a faster rate than the population of Calgary overall. In 2021, 41,350 people in Calgary had an Indigenous identity, up 17 per cent from 35,195 in 2016. During that same five-year period, the population of Calgary overall grew by 5.5 per cent (98-316-X2021001).
Of the Calgarians who had an Indigenous identity, 18,440 identified as First Nations, 20,855 as Métis, 430 as Inuk and 1,630 as having other Indigenous identities including multiple Indigenous identities (98-316-X2021001).
Areas in East Calgary have the largest Indigenous populations in Calgary.
Indigenous income
In the Calgary CMA, people with an Indigenous identity had lower income than those with a non-Indigenous identity. In 2020, the median income of Indigenous peoples in the Calgary CMA was $38,800 compared with $45,200 for those with a non-Indigenous identity (98-10-0282-01).
Currently, low-income (LIM-AT) statistics for people with an Indigenous identity are only available at the provincial level. In Alberta in 2020, 17.1 per cent of people with an Indigenous identity were in low-income compared with 9.2 per cent of Albertans overall. (98-10-0283-01).
Indigenous housing
Poor housing condition and crowding are longstanding housing issues that Indigenous populations in Canada face.
In the Calgary CMA in 2021, the rates of crowding are similar between all residents and those with an Indigenous identity, with about one in 10 people living in unsuitable housing. However, the rates of crowded housing was much higher for those who report being registered under the Indian Act of Canada as Treaty Indians, at two in 10 people living in unsuitable housing (98-10-0285-01).
People with an Indigenous identity in the Calgary CMA in 2021 were about twice as likely to live in housing requiring major repairs than the population of Calgary overall. About 7 per cent of people with an Indigenous identity lived in housing requiring major repairs, compared with about 4 per cent of people in the Calgary CMA overall (98-10-0287-01).
Indigenous languages
In Calgary in 2021, 1,600 people had knowledge of an Indigenous language. The most commonly known Indigenous languages were Blackfoot, Cree (dialect not specified) and Nehiyawewin (Plains Cree) (98-316-X2021001).
Number of Indigenous persons by census tract, 2021
Immigrants
Immigrants
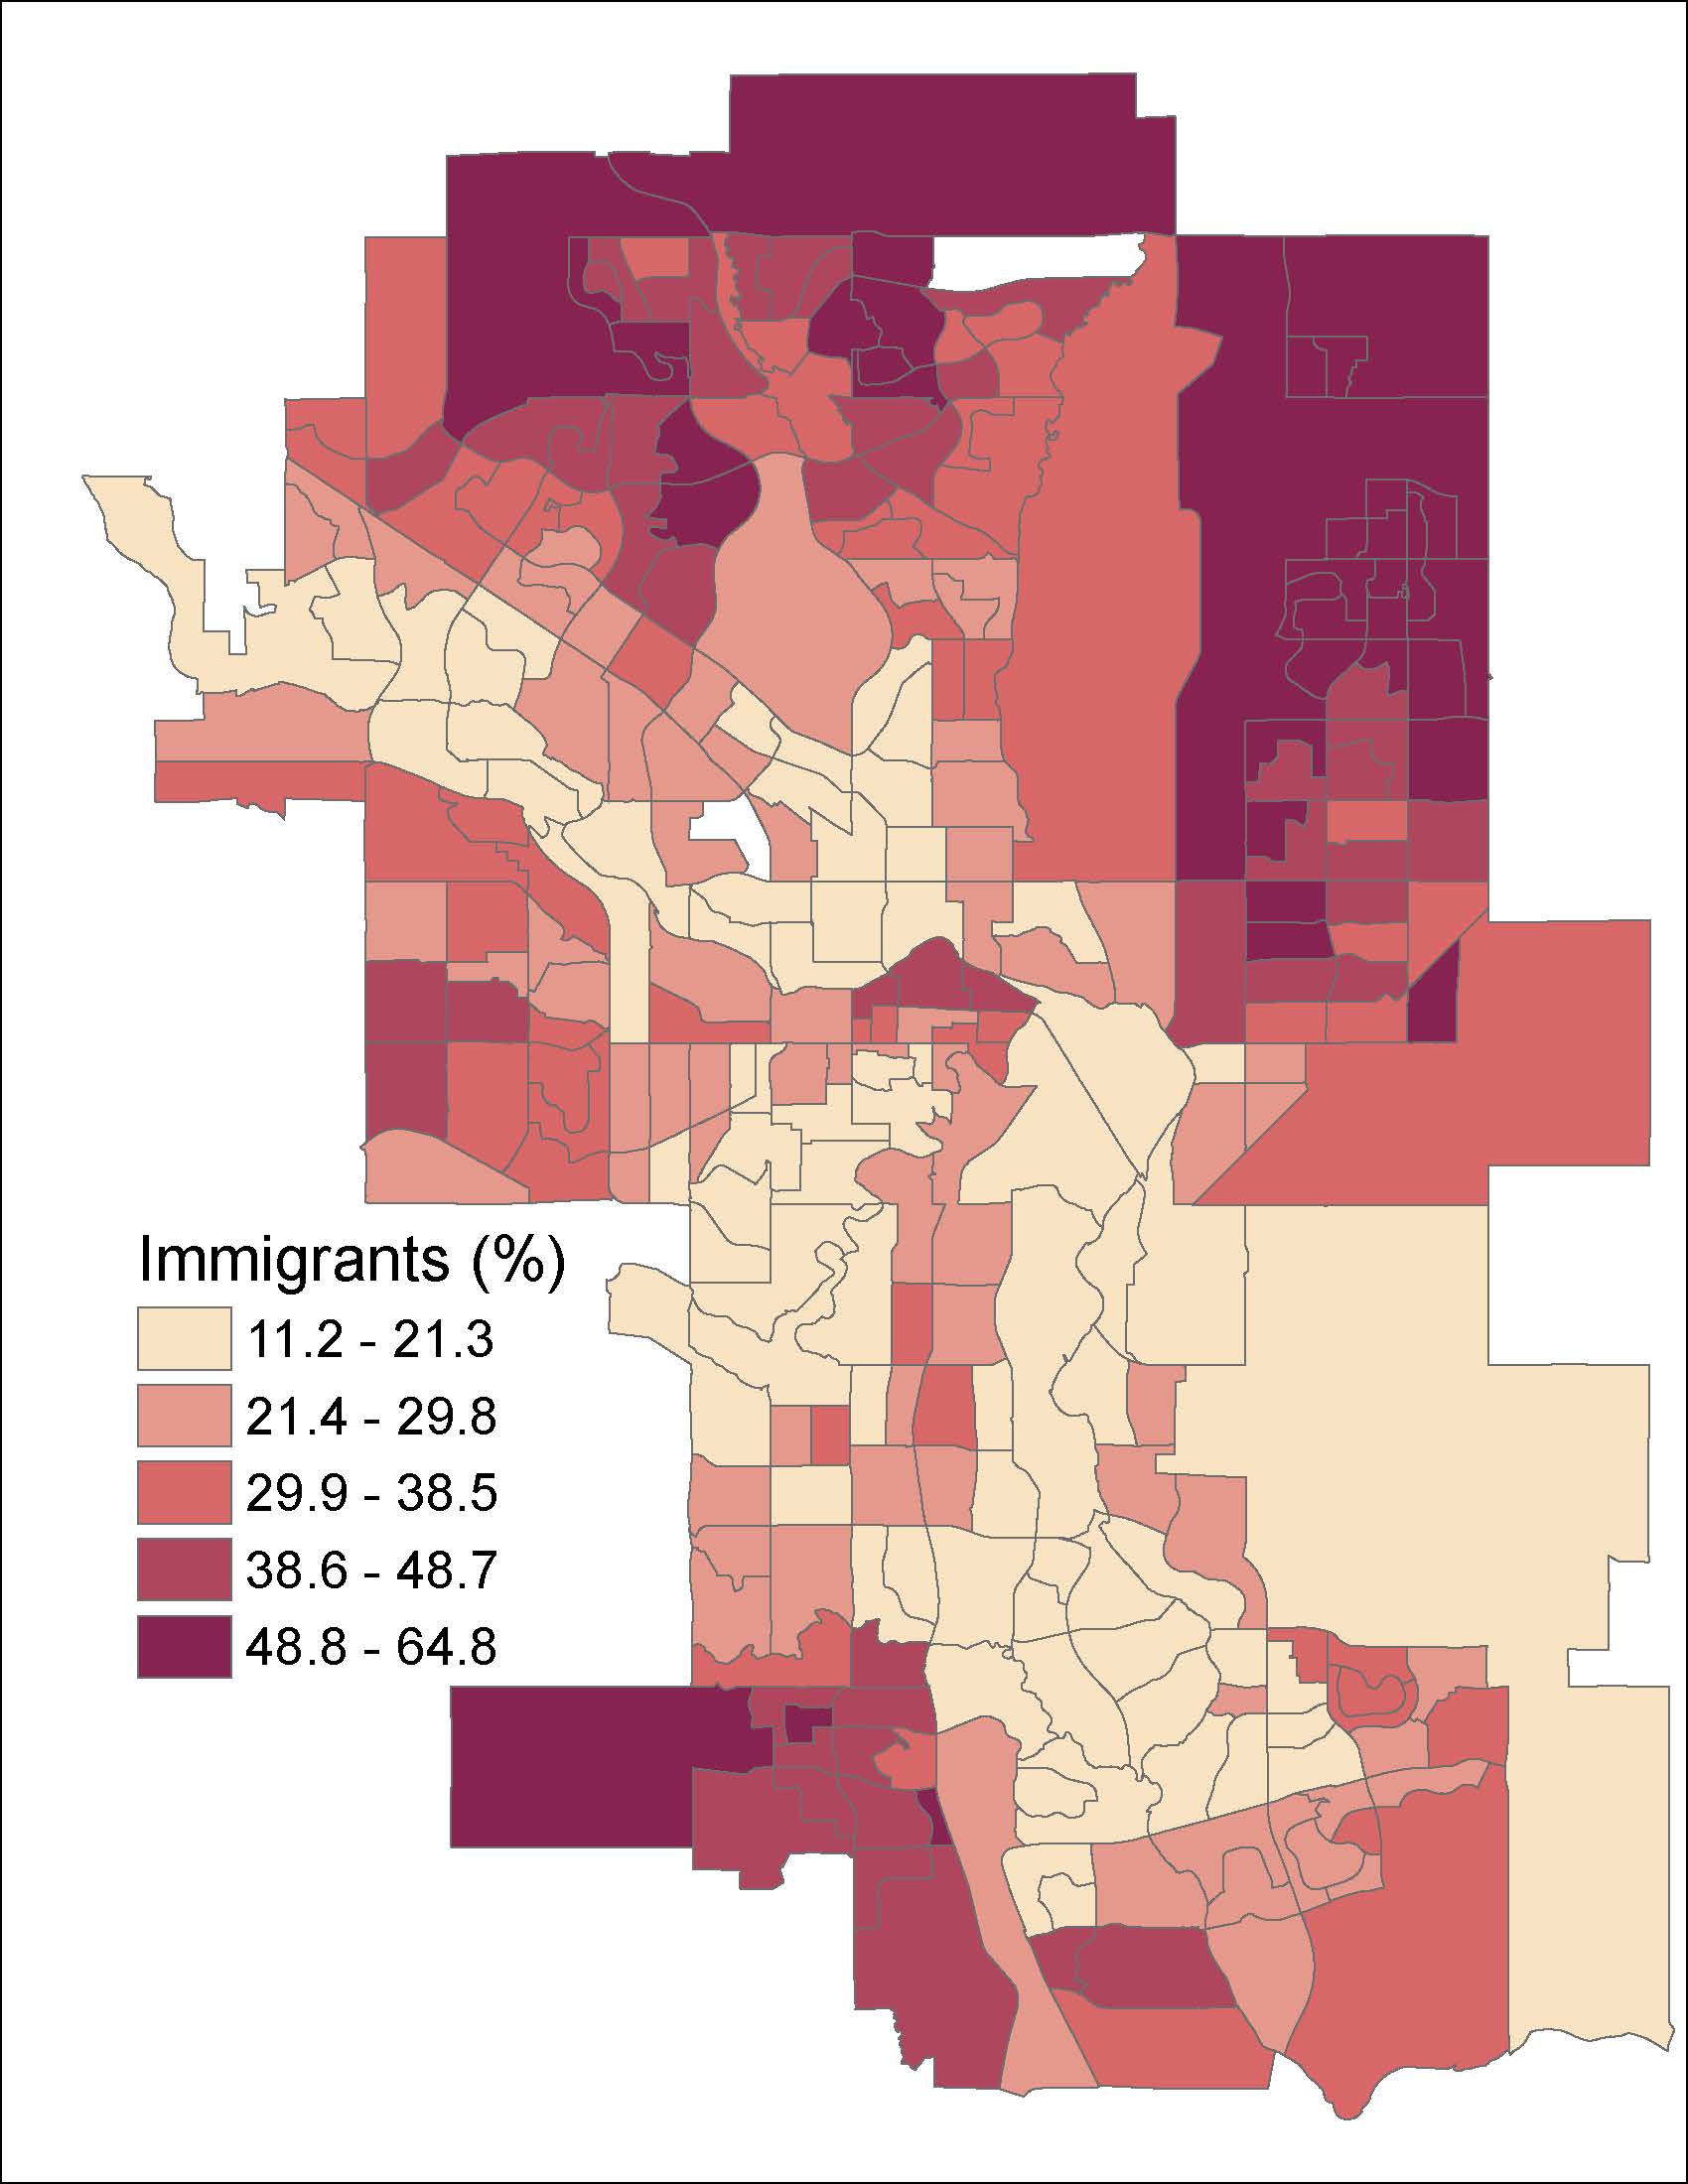
Statistics Canada defines immigrants as persons who are, or who have ever been, landed immigrants or permanent residents. In 2021 in Canada, 23 per cent of the population were immigrants, a new record, the previous record was 22.3 per cent set in 1921. In Calgary in 2021, 33.3 per cent of the population were immigrants, up from 31 per cent in 2016. Most immigrants live in and around the Downtown and on the edges of Calgary (98-316-X2021001).
Together, first and second generation immigrants represent 6 out of 10 residents in Calgary in 2021. In other words, majority of Calgarians today are either first or second generation immigrants (98-316-X2021001).
Per cent immigrants by census tract, 2021
Recent Immigrants
Recent Immigrants
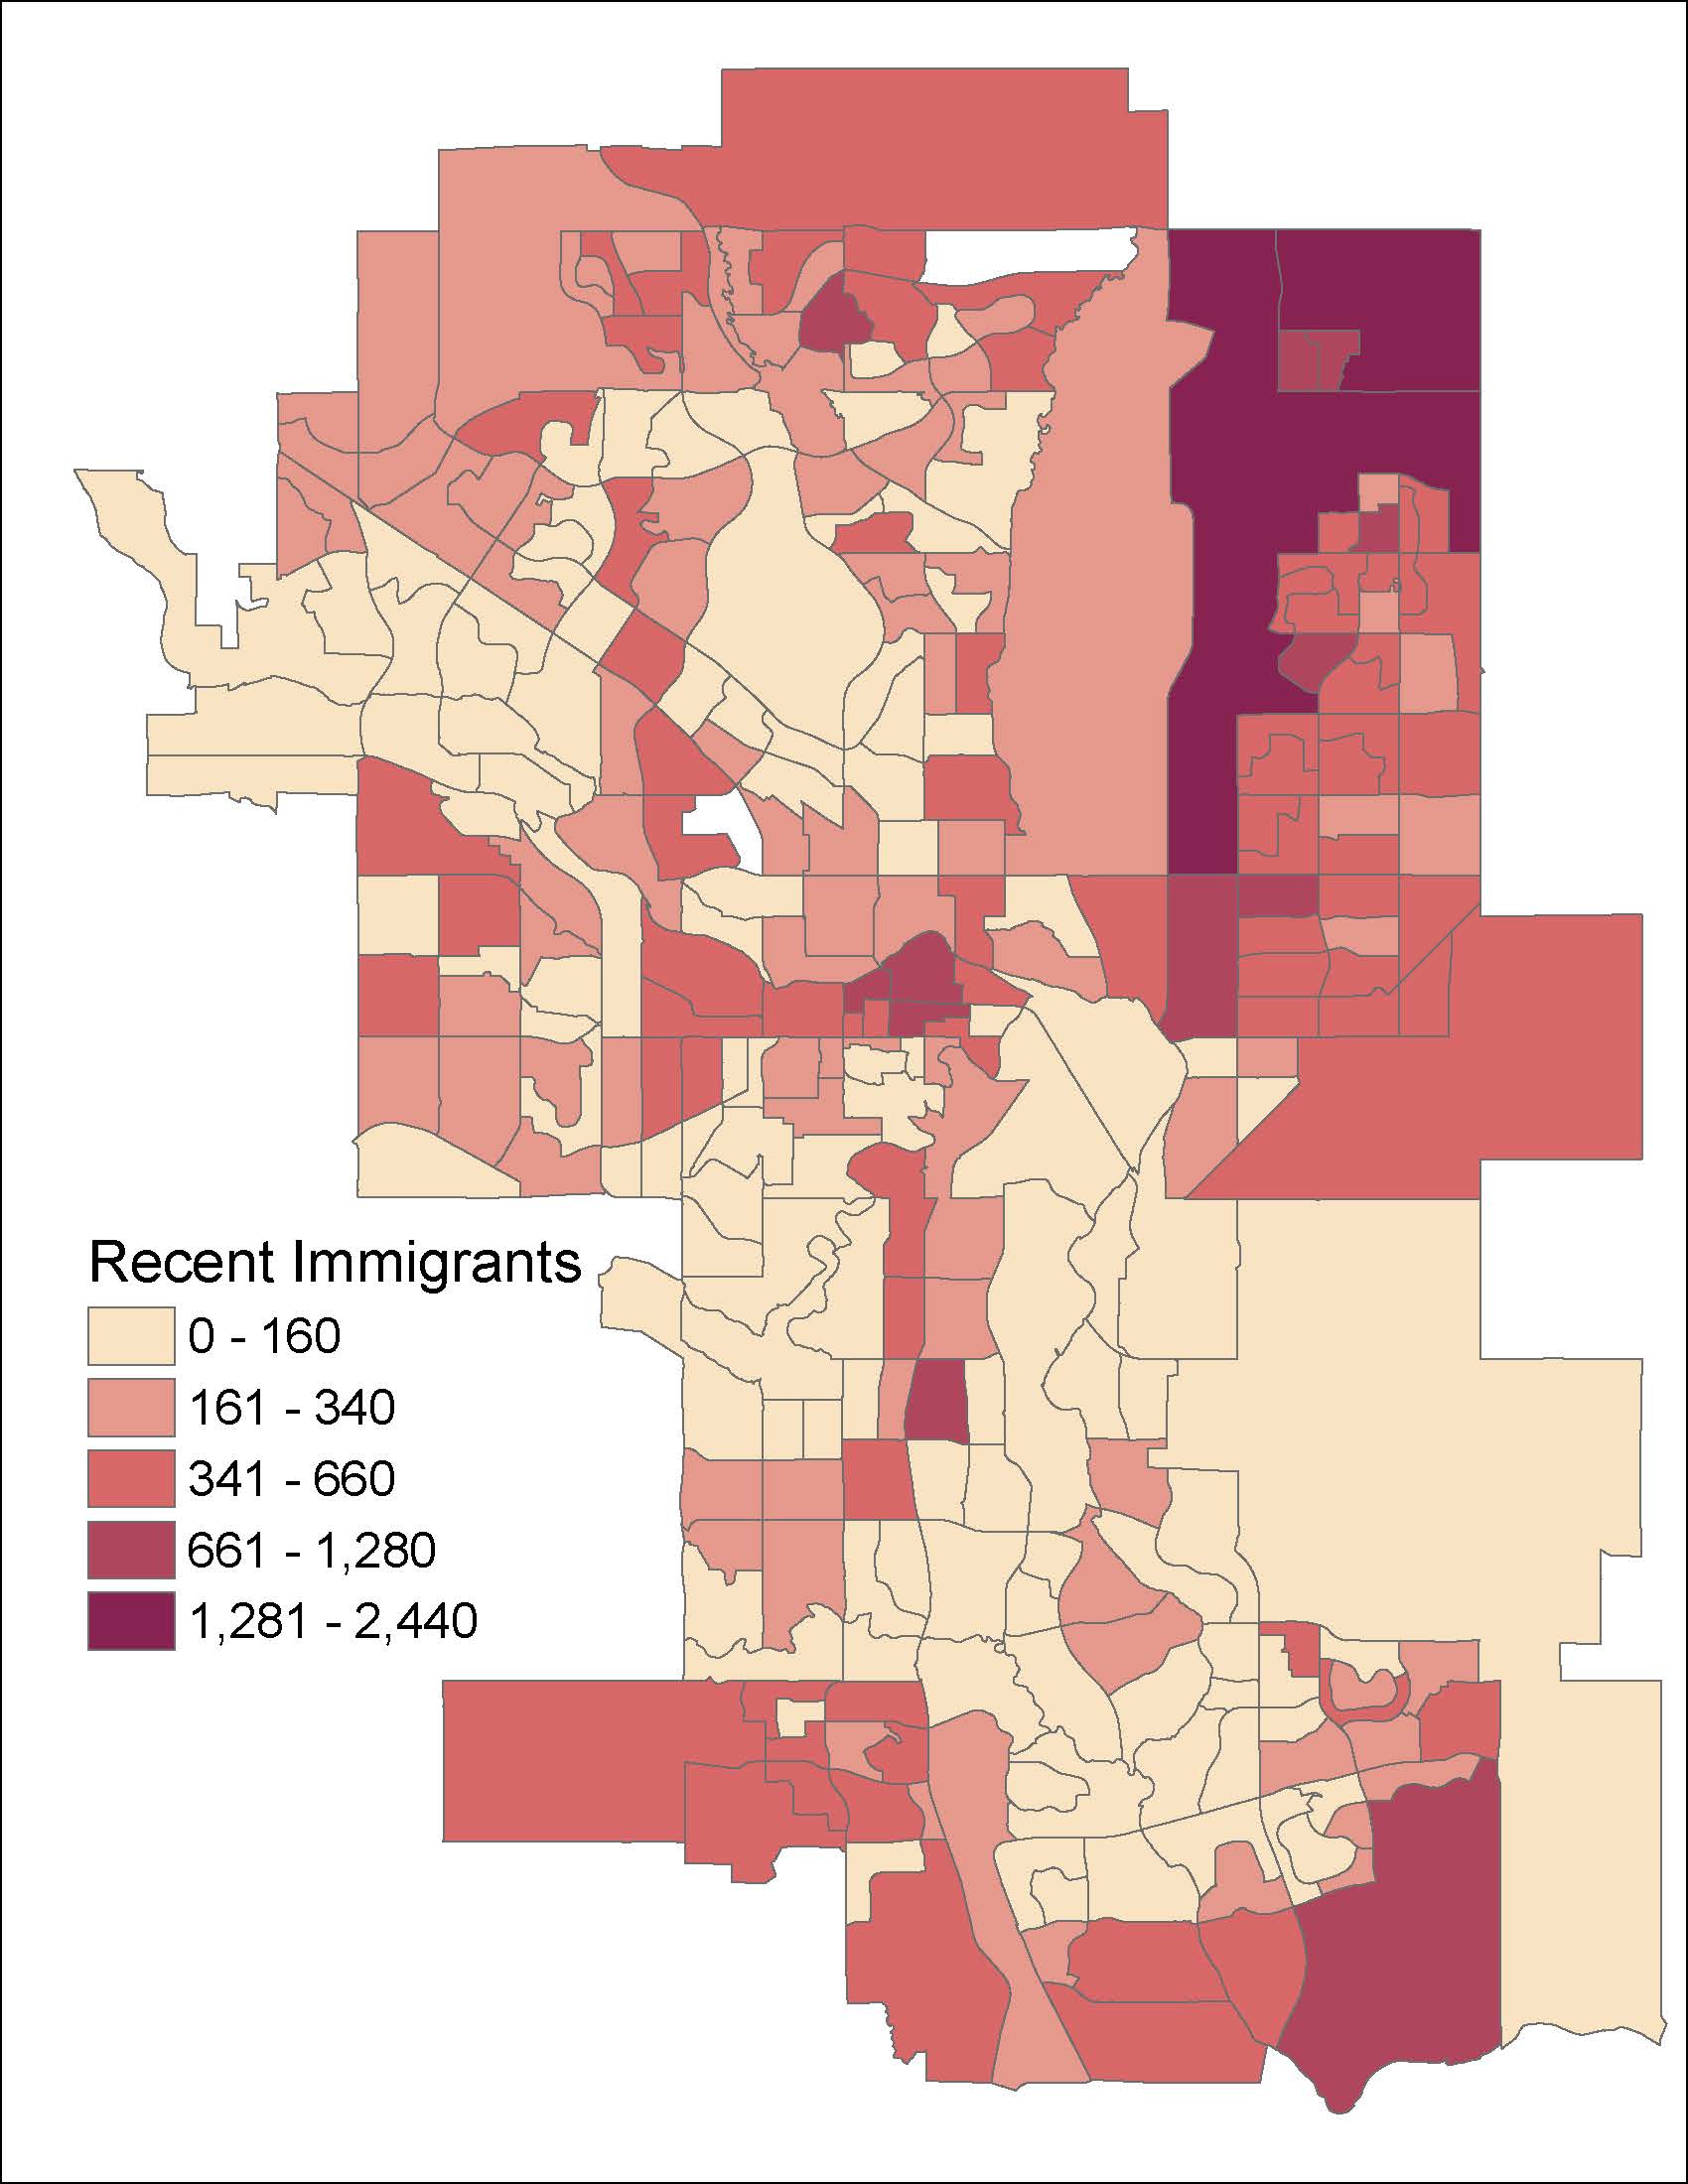
Recent immigrant refers to an immigrant who first obtained their landed immigrant or permanent resident status between January 1, 2016, and May 11, 2021. Between 2016 and 2021, 81,315 recent immigrants came to Calgary. Recent immigrants made up 19 per cent of all immigrants to Calgary, a decline from 23 per cent in 2016 (98-316-X2021001). There could be multiple reasons behind the decline in recent immigrant numbers in Calgary including drop in global oil prices in 2014, and subsequent fewer employment opportunities in Alberta, and COVID-19 travel restrictions in 2020 and 2021. When 2011-2021 is compared to previous decade (2001-2011), the general trend is more recent immigrants to Calgary (170,980 vs 125,255) (98-316-X2021001, 98-316-X2016001, 99- 004-XWE, 92-591-XWE).
Areas on the edges of Calgary, particularly those in the northeast, had the highest number of recent immigrants (98-316-X2021001).
In the Calgary CMA, 16 per cent of recent immigrants were aged between 0 to 14 years, 67 per cent were between 25 to 64 years, and 5 per cent were 65 years and over (98-10-0318-01).
Ten top countries of birth of recent immigrants are presented in the first table on the right. Two out of three recent immigrants to Calgary are from one of these countries (98-316-X2021001).
Around 56 per cent of the total immigrant population in Calgary who arrived since 1980 came as an economic immigrant. Around 28 per cent of immigrants to Calgary were sponsored by family, 15 per cent were admitted as refugees, and 1 per cent as other immigrants. The share of these immigrant admission categories have remained consistent since 2016 (98-316-X2021001).
Among the 81,315 recent immigrants to Calgary in 2021, over 90 per cent came directly from outside Canada while the remaining 10 percent or roughly 8,000 came through interprovincial migration (98-316- X2021001).
Recent immigrants by census tract, 2021
| Ranking | Countries | Counts | Per Cent |
|---|---|---|---|
| Ranking : 1 | Countries : Philippines | Counts: 15,485 | Per Cent: 19% |
| Ranking : 2 | Countries : India | Counts: 14,070 | Per Cent: 17% |
| Ranking : 3 | Countries : Nigeria | Counts: 5,885 | Per Cent: 7% |
| Ranking : 4 | Countries : China | Counts: 5,520 | Per Cent: 7% |
| Ranking : 5 | Countries : Syria | Counts: 3,070 | Per Cent: 4% |
| Ranking : 6 | Countries : Eritrea | Counts: 2,525 | Per Cent: 3% |
| Ranking : 7 | Countries : Pakistan | Counts: 2,315 | Per Cent: 3% |
| Ranking : 8 | Countries : United States of America | Counts: 2,130 | Per Cent: 3% |
| Ranking : 9 | Countries : Ethiopia | Counts: 1,845 | Per Cent: 2% |
| Ranking : 10 | Countries : South Korea | Counts: 1,740 | Per Cent: 2% |
Visible Minority
Visible Minority
Statistics Canada defines visible minorities as persons, other than Aboriginal peoples, who are non-Caucasian in race or non-white in colour. In Calgary in 2021, 41 per cent of the population or 4 out of 10 people identified as a visible minority. Between 2016 and 2021, the visible minority population in Calgary increased by 5 per cent (98-316-X2021001, 98-316- X2016001).
Religion and Ethnic or Cultural Origin
Religion and Ethnic or Cultural Origin
Religion is defined as a person's self-identification as having a connection or affiliation with any religious denomination, group, body, or other religiously defined community or system of belief. In 2021 in Calgary, 45 per cent of the population were Christians, making it the largest religious group. Between 2001 and 2021, the share of Christians in Calgary decreased by more than 20 per cent while the share of the population with no religion and secular perspectives increased by roughly 15 per cent. The second table to the right shows the share of Calgarians across different religious groups and beliefs (98-316-X2021001, 95F0450XCB200100).
Ethnic or cultural origin refers to the ethnic or cultural origin of the person's ancestors. In 2021 in Calgary, 53 per cent of the population identified as having a European ethnic origin. Also, in 2021 in Calgary, 10 per cent of the population identified as having a Canadian origin, a decline of 9 per cent since 2016. The top five ethnic or cultural origins found in Calgary are shown on the last table to the right (98-316-X2021001).
| Ranking | Religion | Counts | Per Cent |
|---|---|---|---|
| Ranking : 1 | Religion : Christian | Counts: 575,250 | Per Cent: 45% |
| Ranking : 2 | Religion : No religion and secular perspectives | Counts: 499,375 | Per Cent: 39% |
| Ranking : 3 | Religion : Muslim | Counts: 95,925 | Per Cent: 7% |
| Ranking : 4 | Religion : Sikh | Counts: 49,465 | Per Cent: 4% |
| Ranking : 5 | Religion : Hindu | Counts: 33,450 | Per Cent: 3% |
| Ranking : 6 | Religion : Buddhist | Counts: 20,855 | Per Cent: 2% |
| Ranking : 7 | Religion : Other religions and spiritual traditions | Counts: 9,695 | Per Cent: 1% |
| Ranking : 8 | Religion : Jewish | Counts: 6,390 | Per Cent: 0.50% |
| Ranking : 9 | Religion : Traditional (North American Indigenous) spirituality | Counts: 1,370 | Per Cent: 0.10% |
| Ranking | Countries | Counts | Per Cent |
|---|---|---|---|
| Ranking : 1 | Countries : English | Counts: 205,980 | Per Cent: 16% |
| Ranking : 2 | Countries : Scottish | Counts: 177,490 | Per Cent: 14% |
| Ranking : 3 | Countries : Irish | Counts: 153,865 | Per Cent: 12% |
| Ranking : 4 | Countries : German | Counts: 146,970 | Per Cent: 11% |
| Ranking : 5 | Countries : Canadian | Counts: 125,490 | Per Cent: 10% |
Labour Force
Labour Force
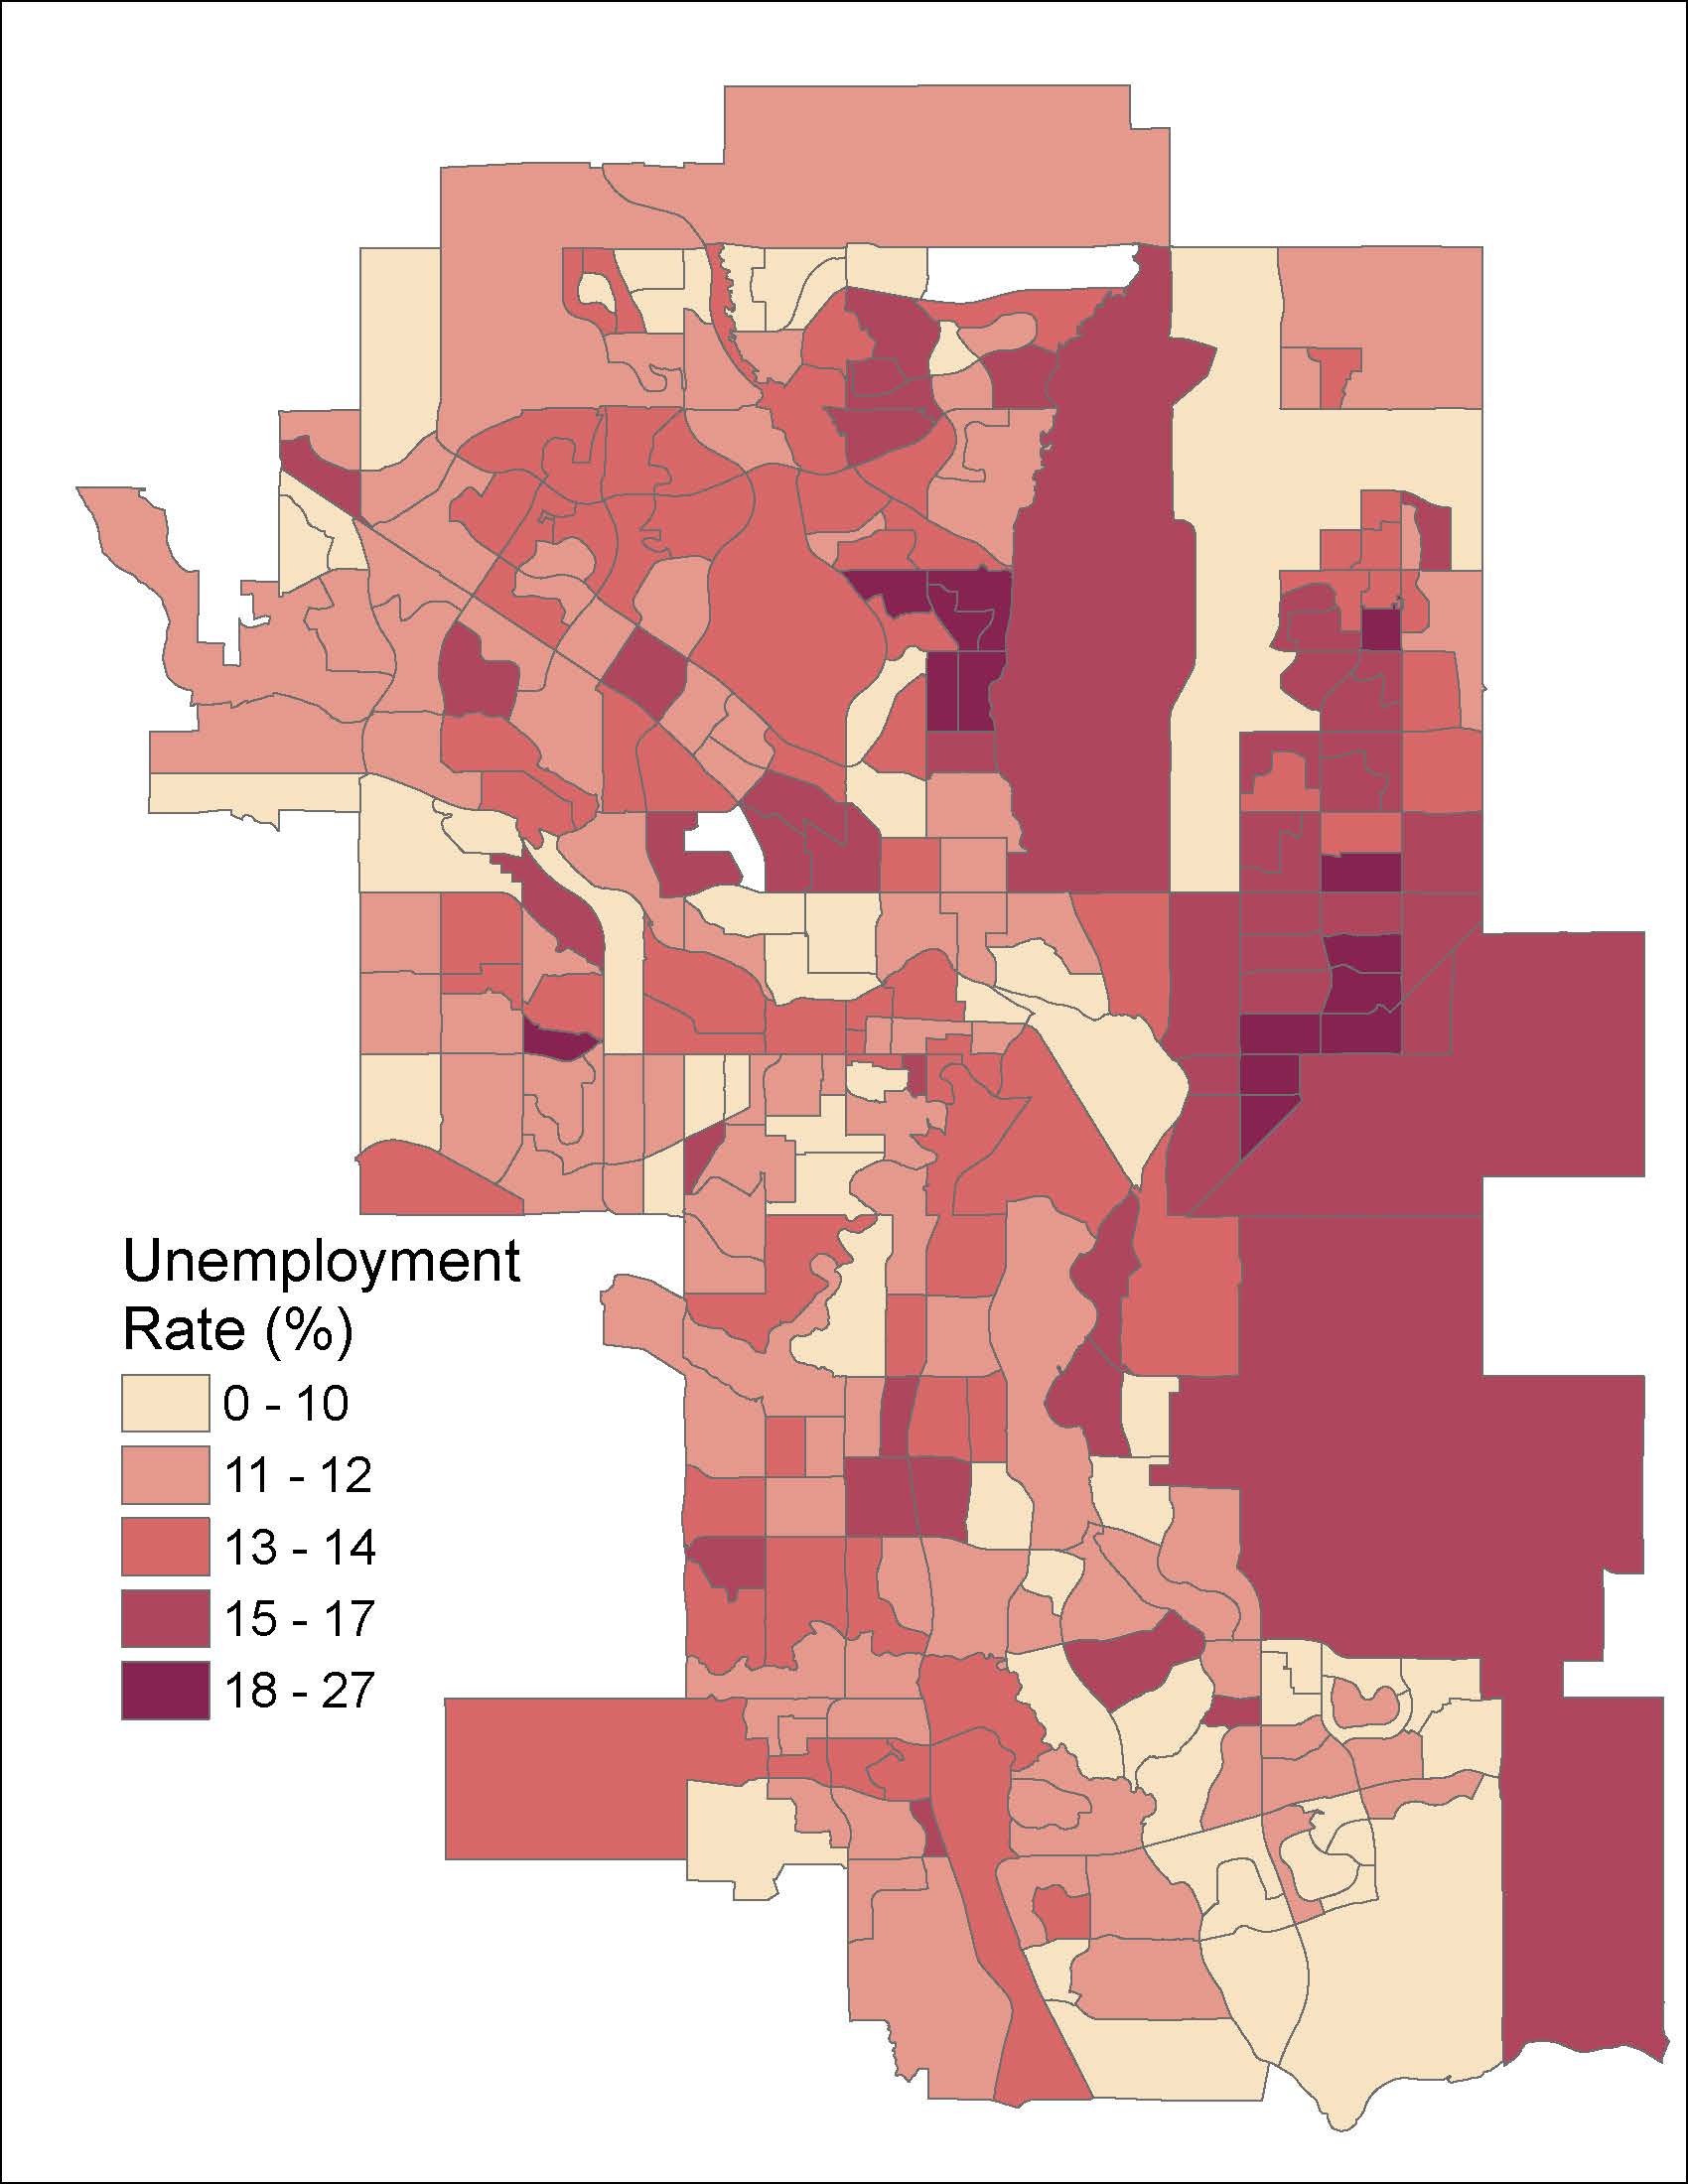
In 2021, there were 730,055 Calgarians in the labour force, and the labour force participation rate1 of Calgarians aged 15 years and over was 69 per cent, down from 73 per cent in 2016. The unemployment rate in 2021 was 12.5 per cent, up 3 per cent from 9.5 per cent in 2016. Areas in the eastern part of Calgary had higher share of unemployed people than other parts of the city as seen on the first image to the right. (98-316-X2016001, 98-316-X2021001).
In 2021, in Calgary CMA2, the labour force participation rate for youth aged 15 to 24 years was 57 per cent, a 6 per cent point drop from 63 per cent in 2016. The unemployment rate for youth in 2021 was 25 per cent, which was more than double the rate for the overall population. One out of five seniors aged 65 years and above were participating in the labour force in 2021 and this has remained unchanged since 2016 (98-10-0446-01).
In 2021, 58 per cent of men+3 in Calgary CMA worked full-time, compared to 57 per cent in 2016. For women+ in 2021, 48 per cent worked full-time, compared to 43 per cent in 2016. While there has been an increase in full time labour force participation among women+, they remain over-represented in part-time work. In 2021, 52 per cent of women+ worked for part of the year and/or part-time, compared to 43 per cent of men+ (98-316-X2021001).
In 2021, 15 per cent of workers in Calgary were self-employed, an increase from 11 per cent in 2016. Of self-employed workers, 40 per cent were female, and increase of 4 per cent since 2016 (36 per cent) (98-316-X2021001).
In Calgary in 2021, the top ten industries by labour force size remained the same as in 2016 which can be found on the table to the right. These top ten industries employed roughly 80 per cent of Calgary’s labour force. The health care and social assistance industry saw the greatest increased since 2016, with more than 90,000 Calgarians working in this industry in 2021 (98-316-X2016001, 98-316-X2021001).
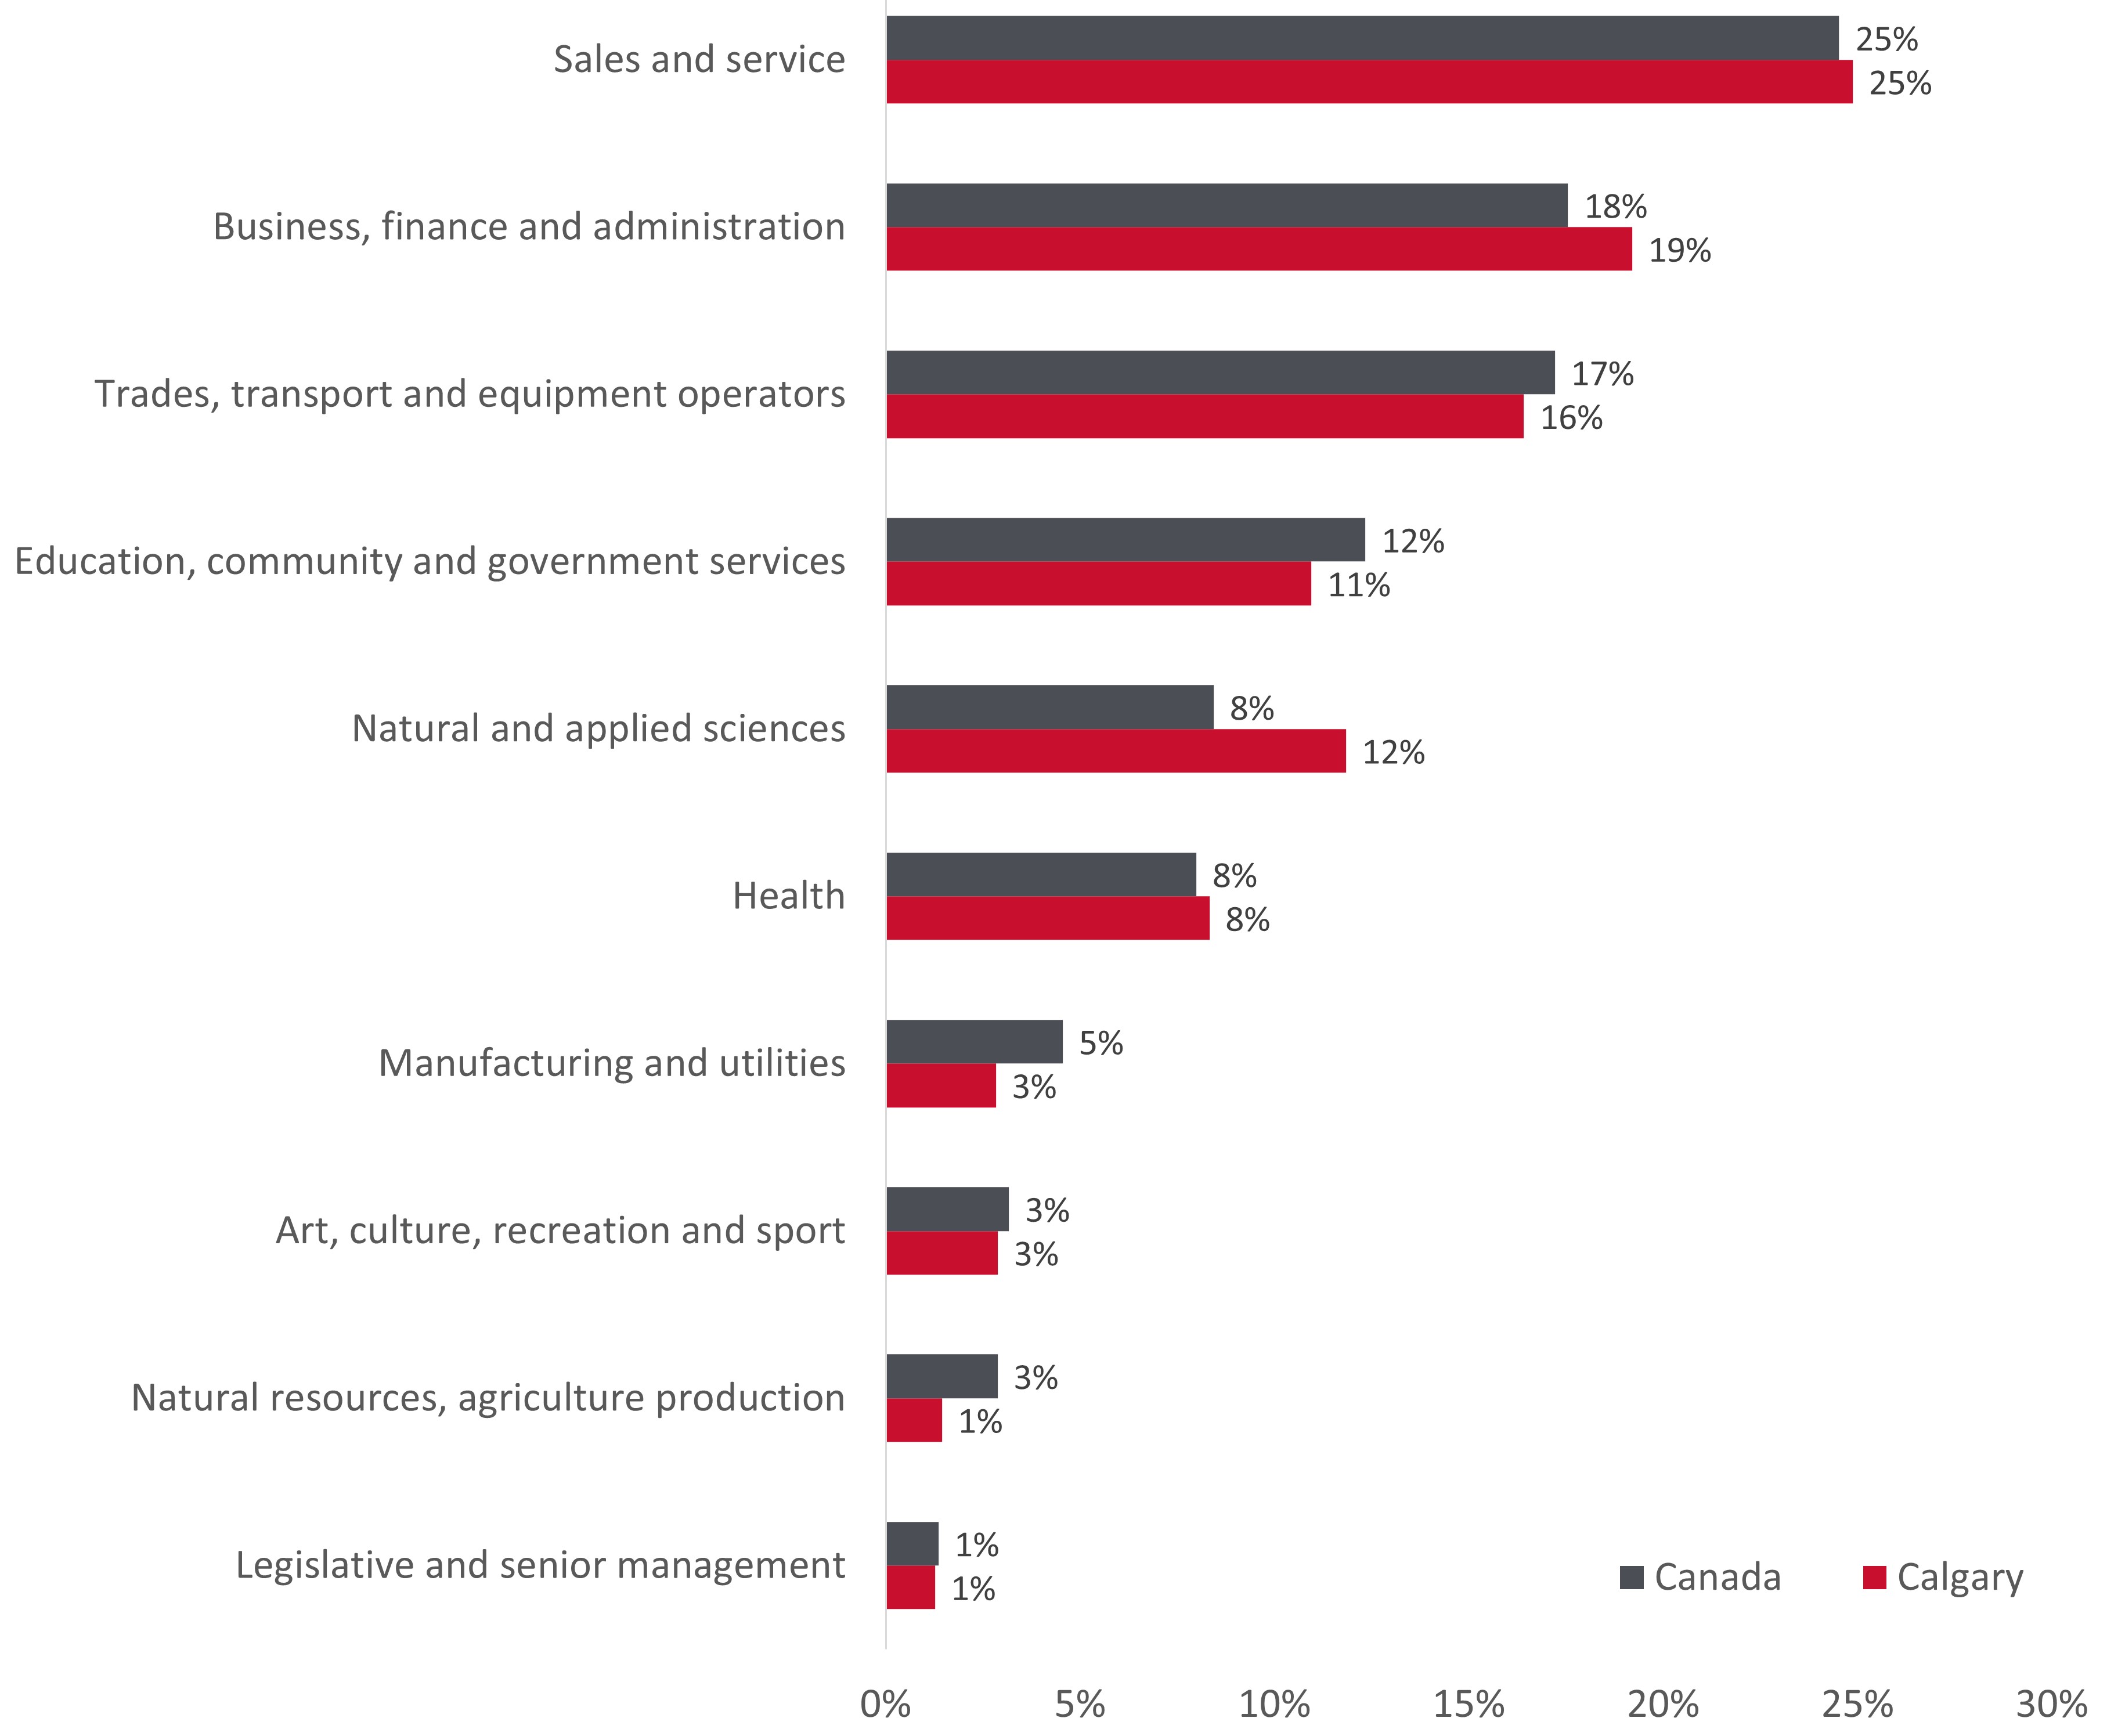
In 2021, for most occupations, the share of labour force in Calgary was similar to that of Canada. However, a higher proportion of the labour force in Calgary was employed in the natural and applied sciences compared to Canada as seen in the chart below (98-316-X2021001).
Per cent unemployed among persons aged 15 years and over by census tract, 2021
| Rank | Top 10 Industries | 2016 | 2021 |
|---|---|---|---|
| Rank: 1 | Top 10 Industries: Health care and social assistance | 2016: 11% | 2021: 13% |
| Rank: 2 | Top 10 Industries: Professional, scientific and technical services | 2016: 11% | 2021: 12% |
| Rank: 3 | Top 10 Industries: Retail trade | 2016: 11% | 2021: 11% |
| Rank: 4 | Top 10 Industries: Construction | 2016: 9% | 2021: 8% |
| Rank: 5 | Top 10 Industries: Transportation and warehousing | 2016: 6% | 2021: 7% |
| Rank: 6 | Top 10 Industries: Educational services | 2016: 6% | 2021: 7% |
| Rank: 7 | Top 10 Industries: Accommodation and food services | 2016: 7% | 2021: 6% |
| Rank: 8 | Top 10 Industries: Manufacturing | 2016: 5% | 2021: 5% |
| Rank: 9 | Top 10 Industries: Mining, and oil and gas extraction | 2016: 6% | 2021: 5% |
| Rank: 10 | Top 10 Industries: Administrative and support, waste management | 2016: 4% | 2021: 4% |
Share of labour force aged 15 years and over by occupation, Canada, and Calgary, 2021
Education
Education
In 2021, 26 per cent of Calgarians held a high school diploma or equivalent as their highest qualification, while 61 per cent held a postsecondary certificate, diploma or degree as their highest qualification. (98-316-X2016001, 98-316-X2021001).
The proportion of Calgarians aged 15 years and over who held a bachelor’s degree or higher increased from 30 per cent in 2011 to 36 per cent in 2021. During the same period, the proportion of people in Canada who held a bachelor’s degree or higher increased from 25 per cent in 2011 to 27 per cent in 2021 (99-004-XWE, 99-014-X2011019, 98-316-X2021001).
The per cent of recent immigrants who held a bachelor’s degree or higher was around 46 per cent in 2016 and in 2021 in Calgary CMA, 10 per cent higher than the rate for the overall population. The labour force participation rate for these recent immigrants was also higher than the overall educated population in 2016 and 2021 (80 per cent compared to 85 per cent) (98-10-0446-01).
The most common major fields of study for those with postsecondary qualifications in Calgary has remained the same since 2016 with business and management and public administration (14 per cent), architecture and engineering and related technologies (13 per cent), and health and related fields (9 per cent) representing the top three major fields of study (98-316-X2021001). In addition, Calgary continues to have a higher percent of its population aged 15 and over with their highest certificate, diploma or degree in STEM4 subjects compared to Canada’s population aged 15 years and over (16 per cent vs 11 per cent in 2021) (98-10-0393-01).
Commute to work
Commute to work
During the COVID-19 pandemic, the working and commuting patterns of Calgarians changed. In 2021, in Calgary, 29 per cent of the employed labour force aged 15 years and over worked at home, compared to 7 per cent in 2016 (98-316-X2016001, 98-316-X2021001).
In 2021, 83 per cent of employed Calgarians aged 15 years and over got to work in a car, truck or van as either a driver or passenger, higher than 76 per cent in 2016. The proportion of Calgarians taking public transit to work fell from 16 per cent in 2016 to 9 per cent in 2021. In 2016, nearly 10,000 Calgarians used a bicycle as their main mode of commuting while in 2021 this number fell to just under 4,000 (98-316-X2016001, 98-316-X2021001).
In 2021, in Calgary CMA, 13 per cent of people with employment income used sustainable transportation5 to get to work, a sizable drop from 21 per cent in 2016. This trend was observed across all income groups, however, people with lower employment income continued to be more likely to use sustainable transportation to get to work than those with higher employment income (98-400-X2016332, 98-10-0463-01).
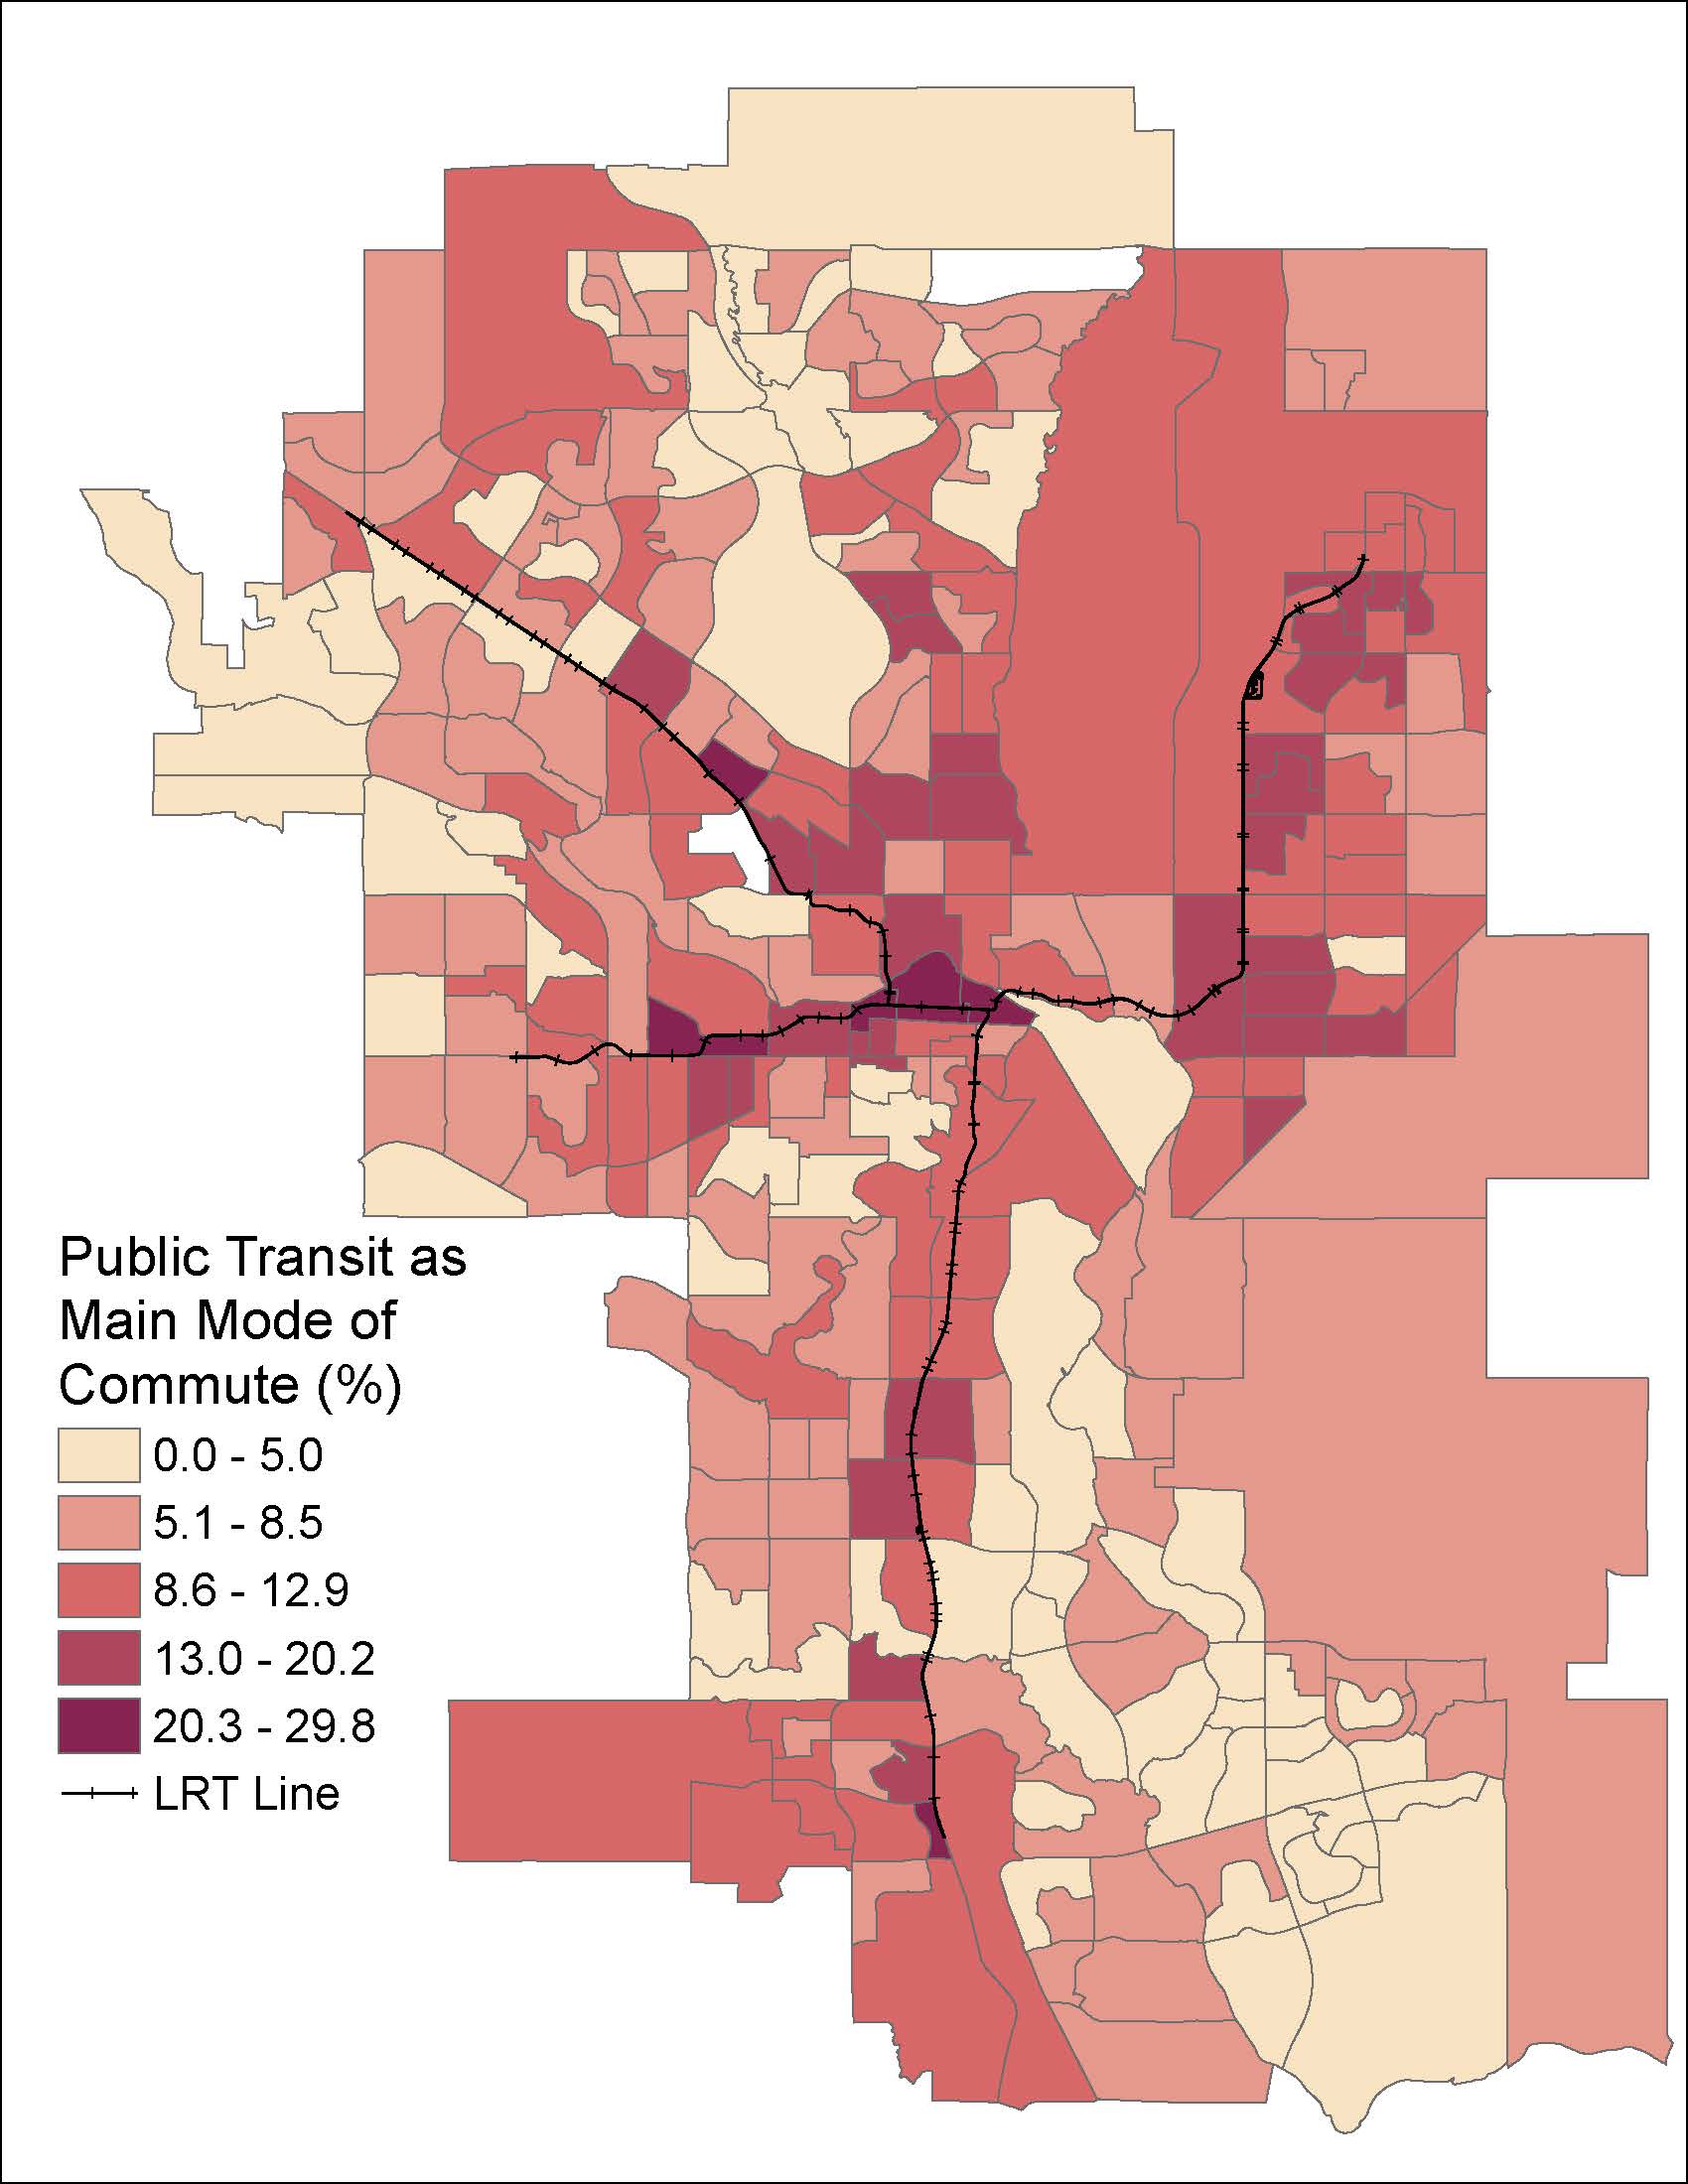
In Calgary CMA, one in six people (17 per cent) with employment income under $30,000 used sustainable transportation to get to work, compared to 8 per cent of those earning $50,000 to $99,999. Of those with employment income of $100,000 or more, 10 per cent used sustainable transportation to get to work, a drop from 21 per cent in 2016. The image to the right shows the share of the employed labor force aged 15 years and over who use public transit as their main mode of transportation to commute to work. A higher share of workers who live in and around the Downtown Core and along the light-rail transit (LRT) lines use public transit to go to work (98-316-X2021001, 98-10-0463-01).
During the COVID-19 pandemic, the working and commuting patterns of Calgarians changed. In 2021, in Calgary, 29 per cent of the employed labour force aged 15 years and over worked at home, compared to 7 per cent in 2016 (98-316-X2016001, 98-316-X2021001).
In 2021, 83 per cent of employed Calgarians aged 15 years and over got to work in a car, truck or van as either a driver or passenger, higher than 76 per cent in 2016. The proportion of Calgarians taking public transit to work fell from 16 per cent in 2016 to 9 per cent in 2021. In 2016, nearly 10,000 Calgarians used a bicycle as their main mode of commuting while in 2021 this number fell to just under 4,000 (98-316-X2016001, 98-316-X2021001).
In 2021, in Calgary CMA, 13 per cent of people with employment income used sustainable transportation5 to get to work, a sizable drop from 21 per cent in 2016. This trend was observed across all income groups, however, people with lower employment income continued to be more likely to use sustainable transportation to get to work than those with higher employment income (98-400-X2016332, 98-10-0463-01).
In Calgary CMA, one in six people (17 per cent) with employment income under $30,000 used sustainable transportation to get to work, compared to 8 per cent of those earning $50,000 to $99,999. Of those with employment income of $100,000 or more, 10 per cent used sustainable transportation to get to work, a drop from 21 per cent in 2016. Figure 2 shows the share of the employed labor force aged 15 years and over who use public transit as their main mode of transportation to commute to work. A higher share of workers who live in and around the Downtown Core and along the light-rail transit (LRT) lines use public transit to go to work (98-316-X2021001, 98-10-0463-01).
Per cent employed labour force who used public transit as main mode of commute by census tract, 2021
Instruction in the minority language
Statistics Canada collected language of instruction data for the first time during the 2021 census. In last week’s release, Statistics Canada shared information on enumerated children under the age of 18 who were eligible for instruction in the minority official language for communities across Canada. Out of roughly 900,000 children who were eligible for instruction in the minority official language in Canada, 2.5 per cent or 24,000 were in Calgary (see https://www150.statcan.gc.ca/n1/daily-quotidien/221130/dq221130d-eng.htm).
Data about specific topics and populations in Calgary
| Topic or population | Specific research products |
|---|---|
| Topic or population: |
Specific research products:
|
| Topic or population: |
Specific research products:
|
| Topic or population: |
Specific research products:
|
| Topic or population: |
Specific research products:
|
| Topic or population: |
Specific research products:
|
Other research-related reports about Calgary
- 2016 Needs and Preferences Study city wide report - Outlines data on residents’ needs and desires for recreation, leisure and social programming in their community and thoughts about their community association. Watch the video outlining the results.
- Indices of Community Well-being 2006 (2010) - Detailed report examining Calgary’s communities according to the dimensions of economic, social, and physical well-being. The well-being of communities is ranked relative to one another and presented in a map and table format.
- Signposts (2012 and 2014) - Reports on community assessment surveys conducted in 2006 that explored the social issues and needs of Calgarians. Results are reported city-wide as well as at the social district level.